Metabarcoding
High-throughput marker gene sequencing for species identification and biodiversity assessment
Learn more 16S rRNA
Metabarcoding
The gold standard for bacterial and archaeal community profiling. The 16S ribosomal RNA gene contains conserved regions for primer binding and hypervariable regions for species discrimination, enabling comprehensive microbiome analysis across diverse sample types.
Minimum 1 × 15 mL conical tube
Single-band amplicon from markers (16S/18S/ITS) with ≥ 30 ng/µL (Qubit) in ≥ 30µL volume
At least 3 biological replicates per sample are HIGHLY recommended for statistical analysis and robust scientific evidence.
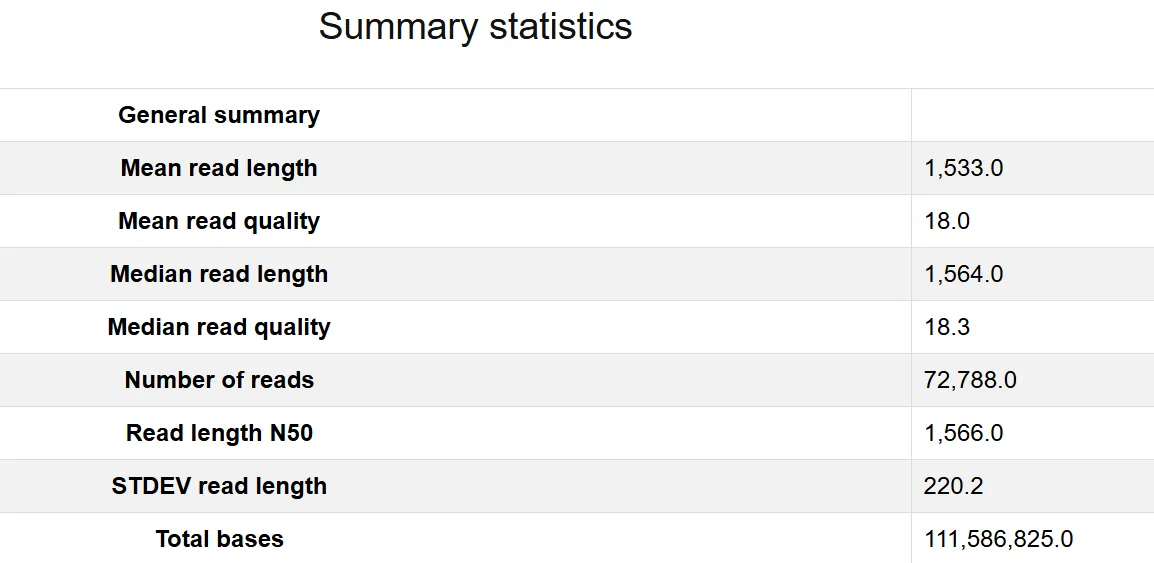
Quality Check Report
Per-sample read quality metrics, coverage depth, and basecalling statistics.
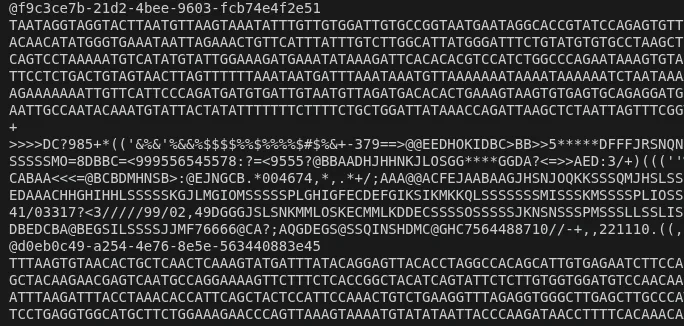
Raw Sequencing Files
Raw sequencing reads in standard formats for downstream analysis.
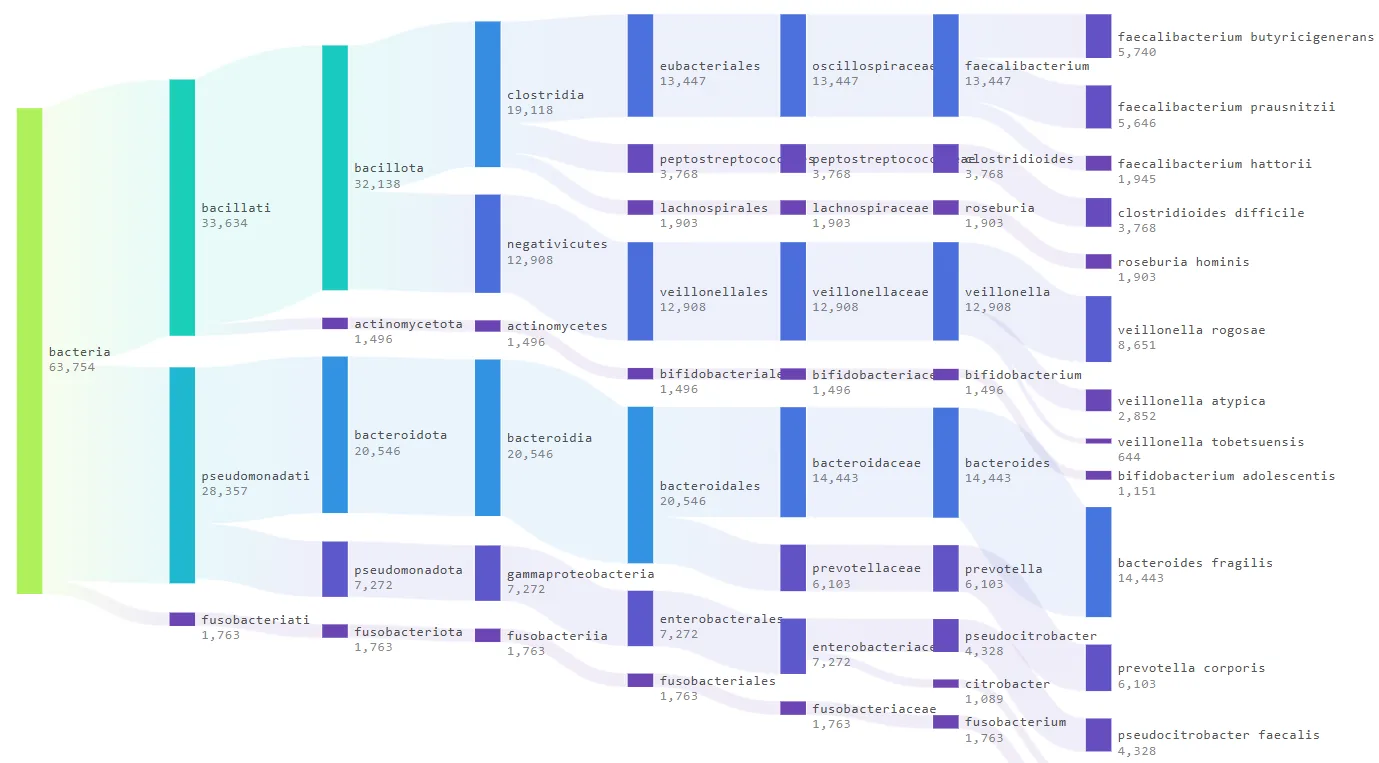
Lineages Plot
Full hierarchical lineage assignments from domain to species level per sample.
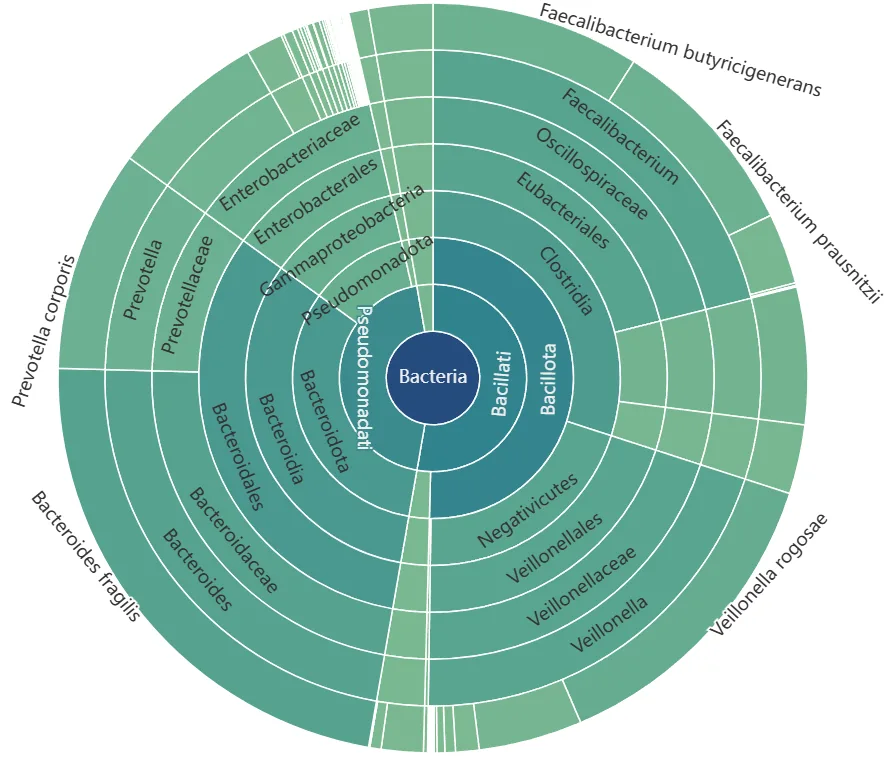
Sunburst Chart
Radial hierarchical visualization of community composition across taxonomic ranks.
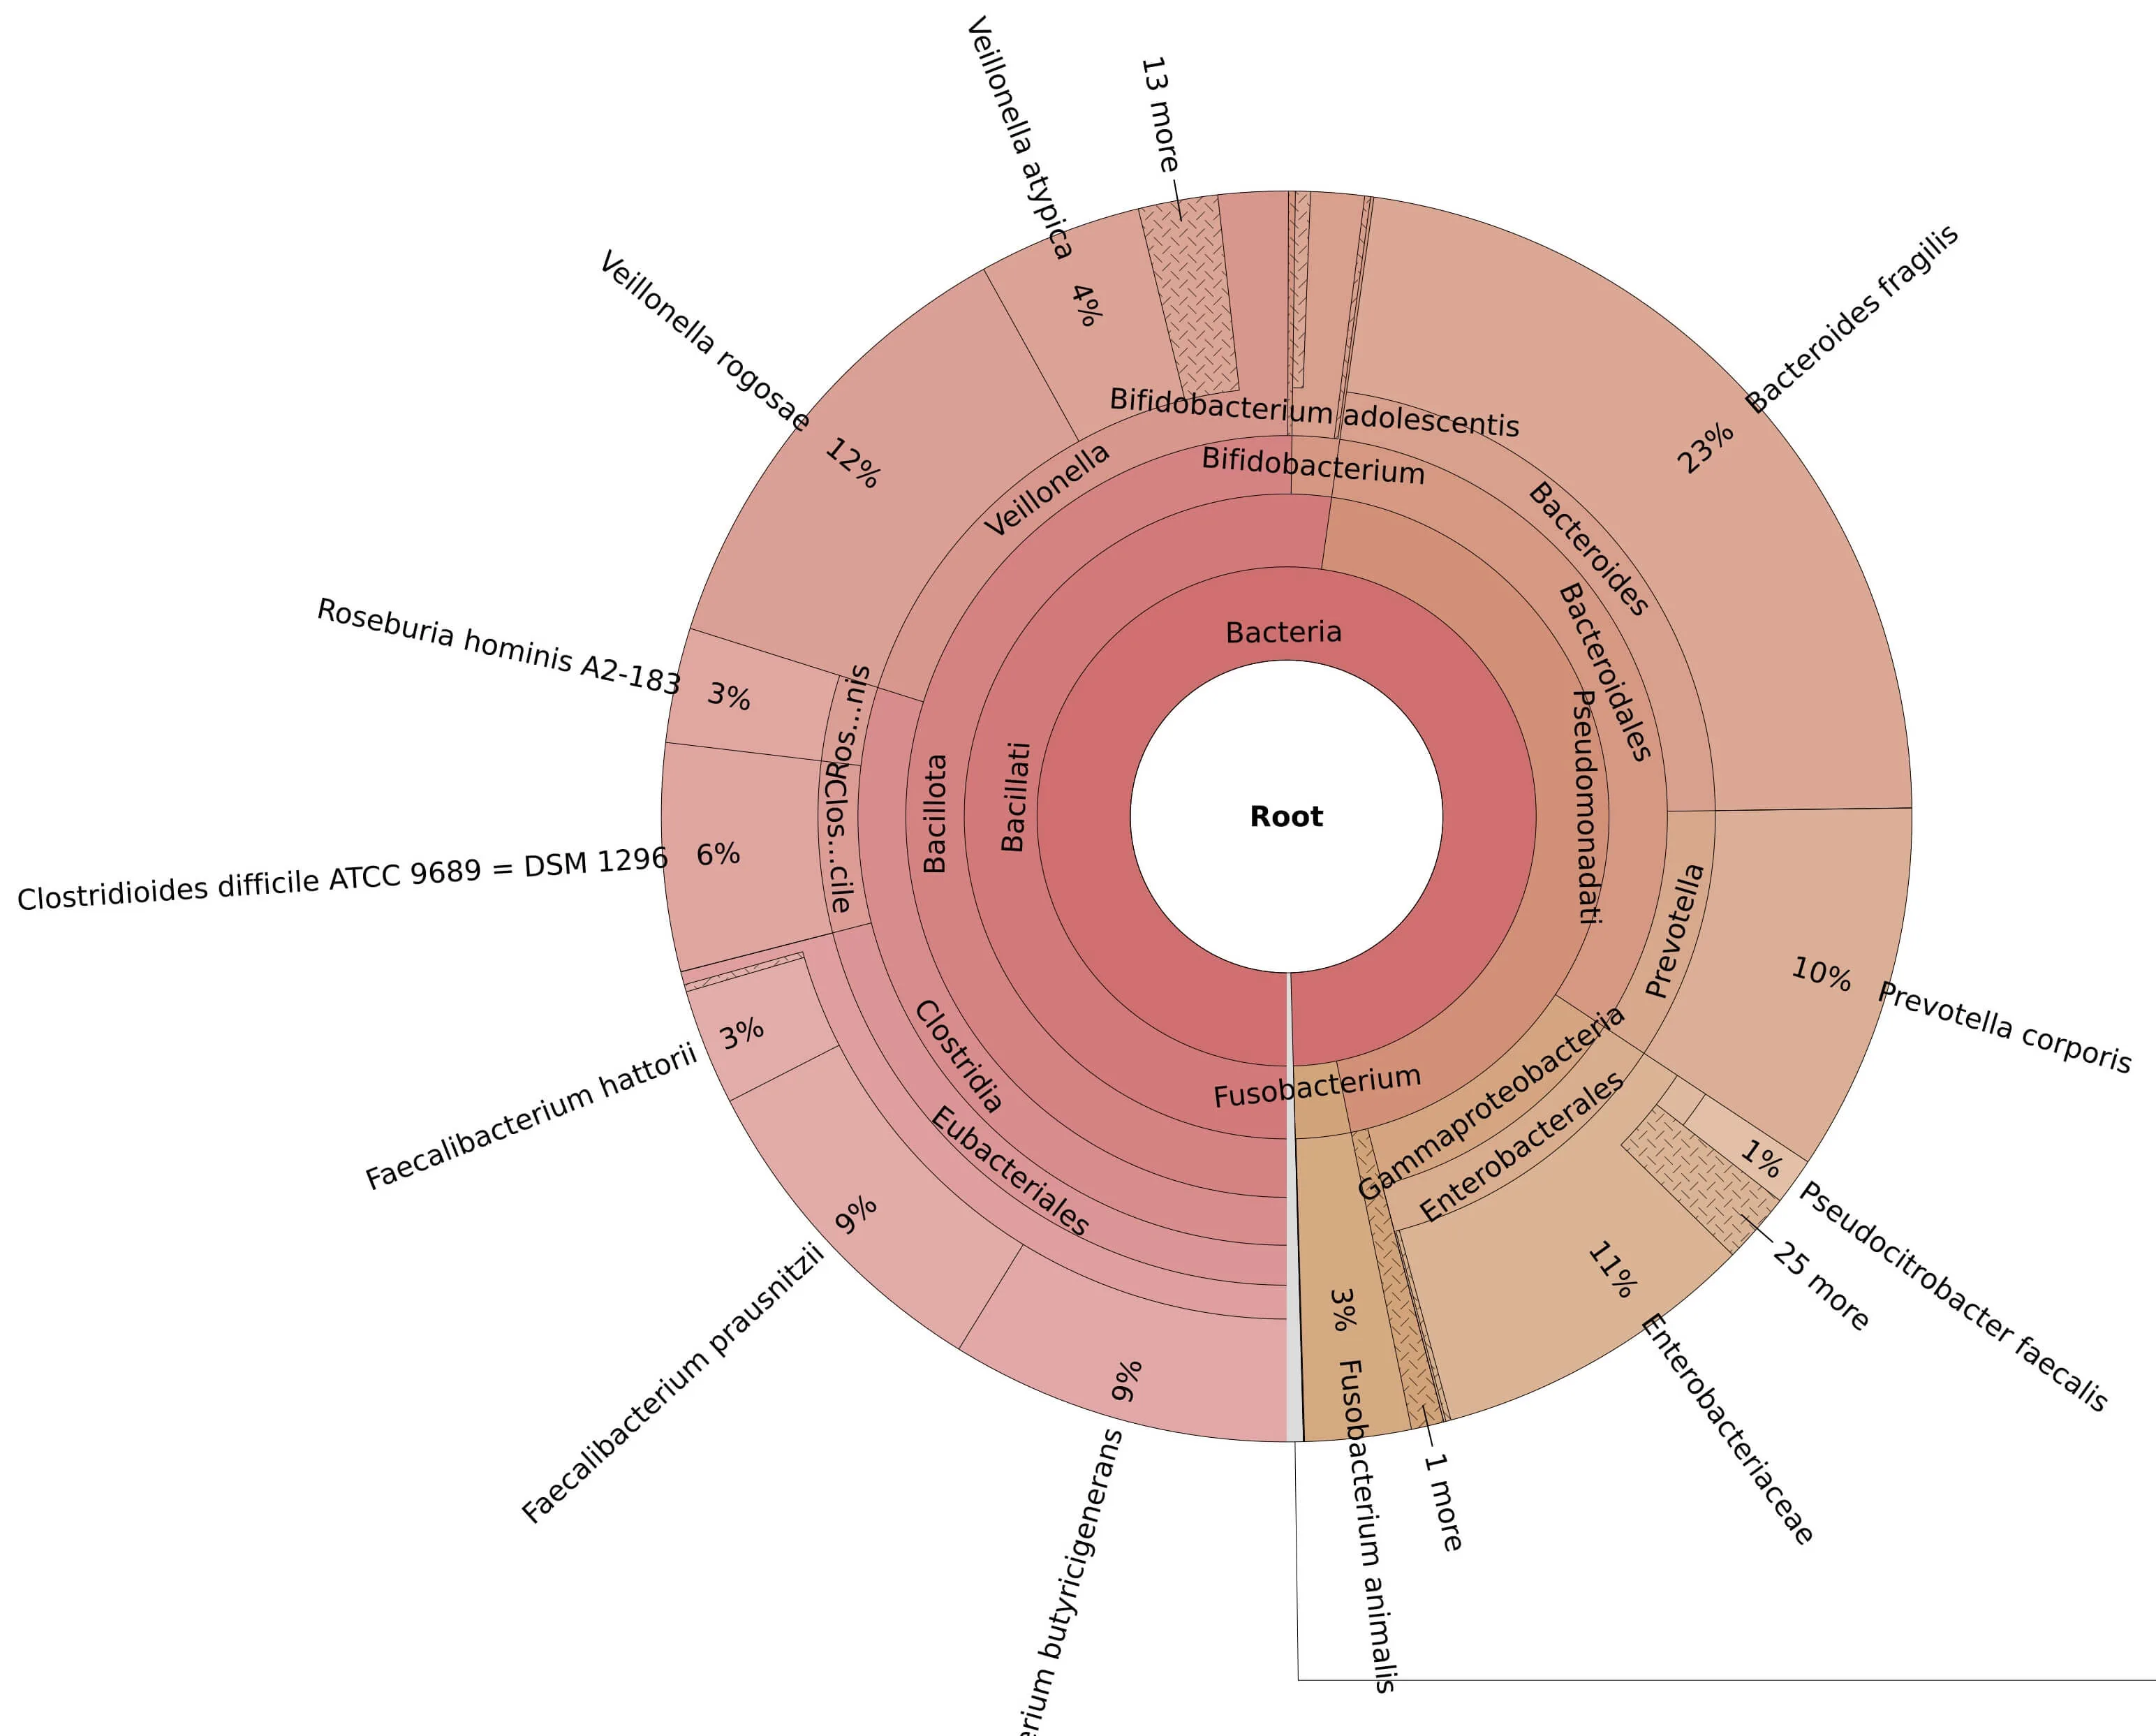
Krona Chart
Interactive Krona HTML chart for exploring per-sample taxonomic composition.
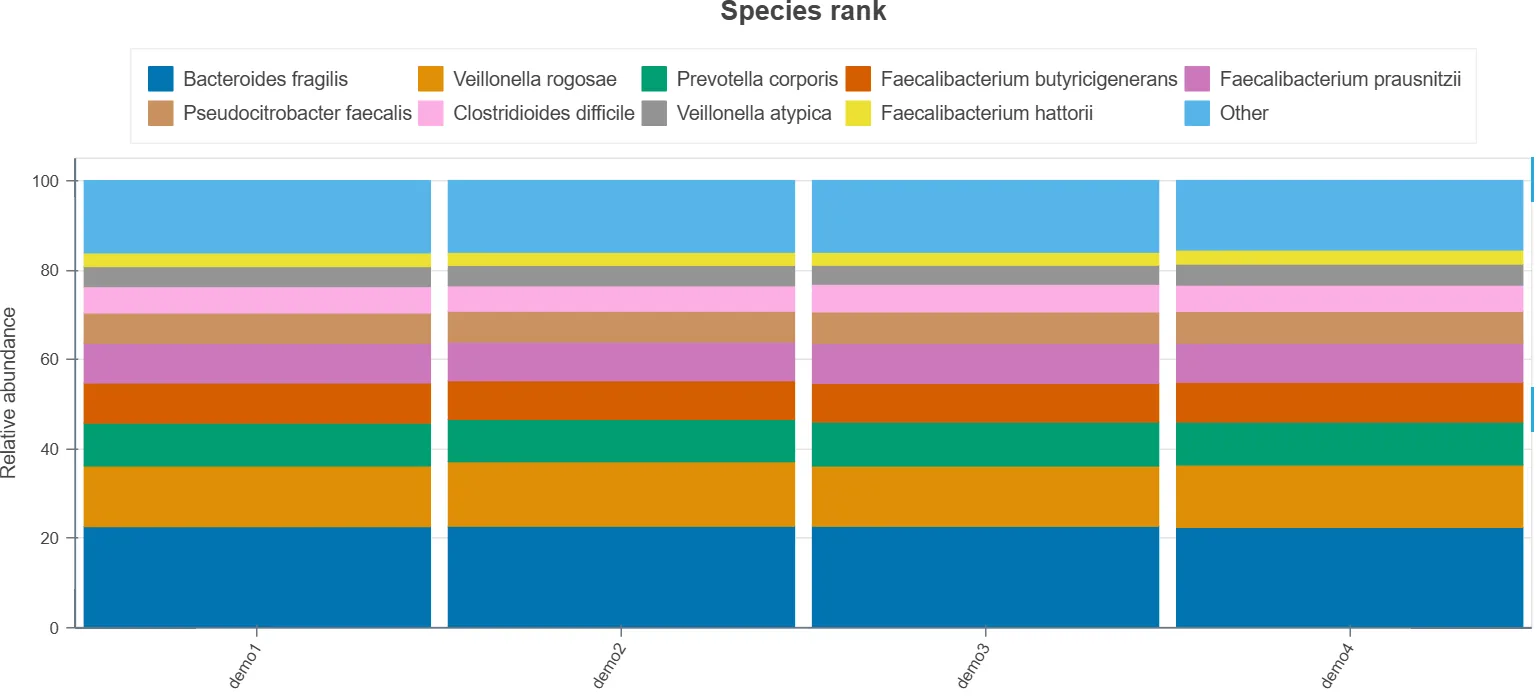
Taxonomic Barplot
Stacked bar chart of relative taxonomic abundance across all samples at multiple ranks.
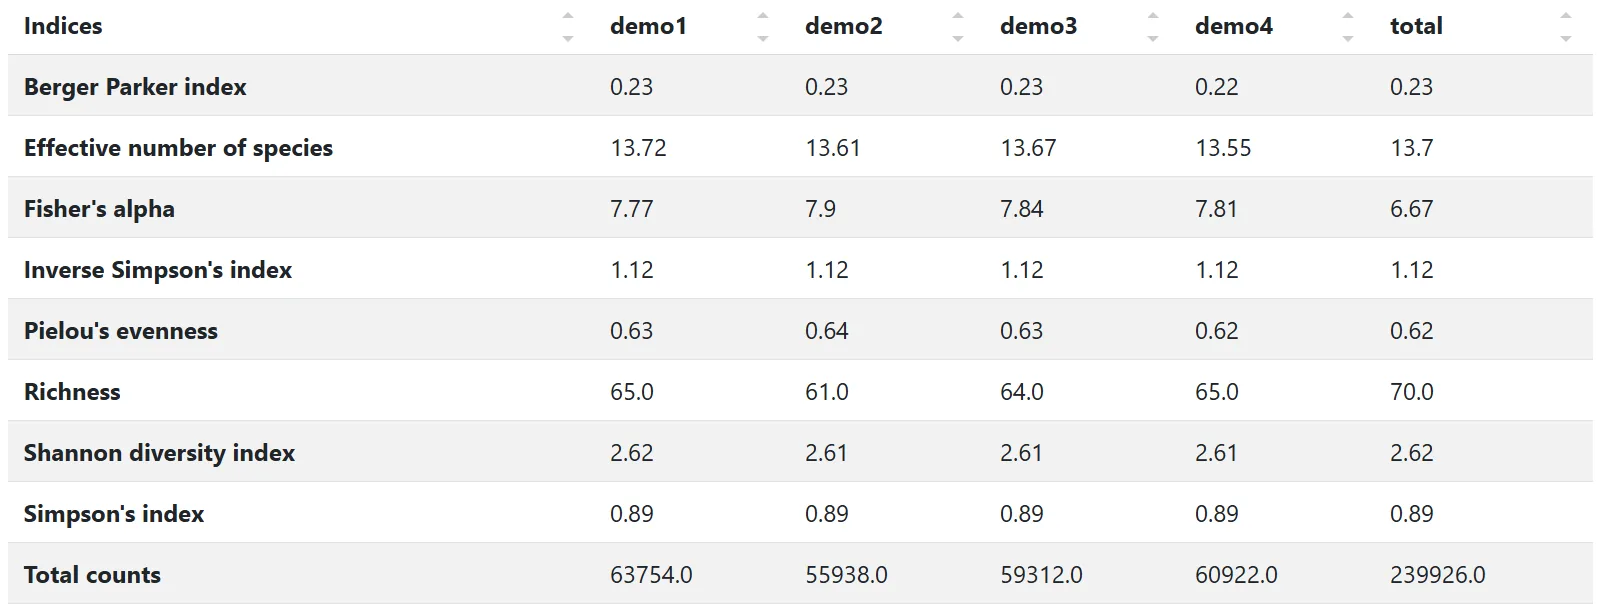
Alpha Diversity Indices
Statistical diversity metrics summarizing community richness and evenness.
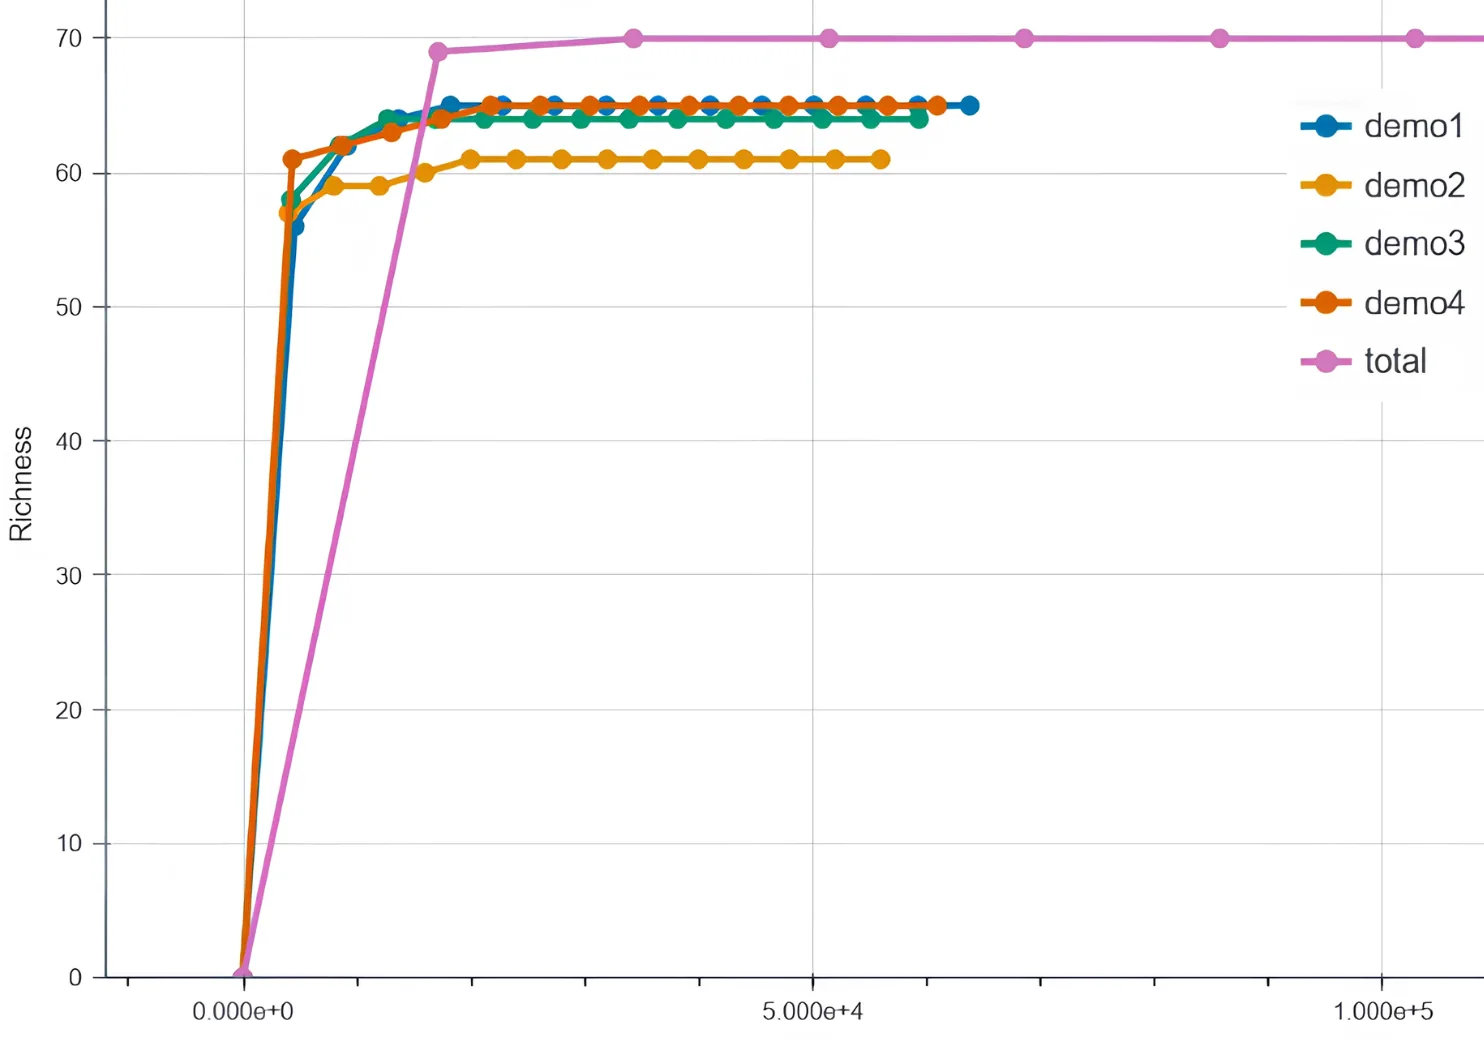
Rarefaction Curve
Species accumulation curves showing observed diversity as a function of sequencing depth.
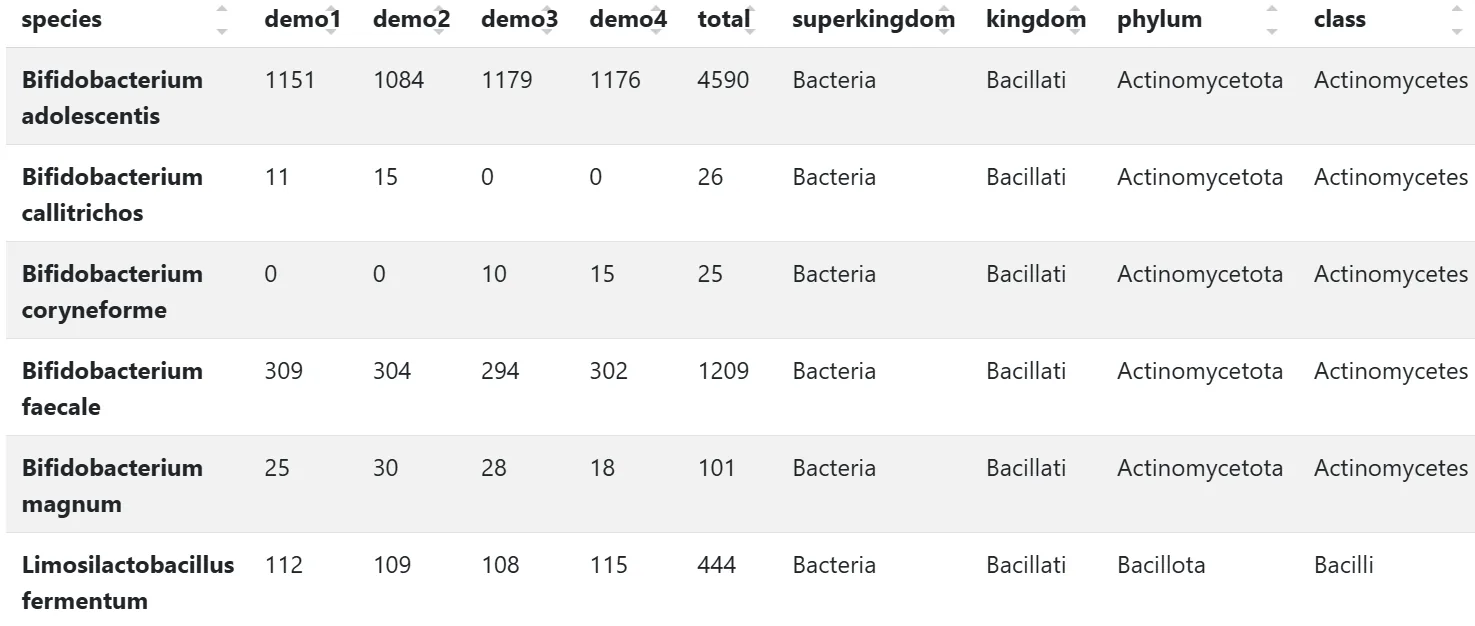
Abundance Table
Quantitative abundance across all sequenced samples.
18S rRNA
Metabarcoding
Targets the 18S ribosomal RNA gene for profiling eukaryotic microbial communities including protists, algae, and other unicellular eukaryotes. Essential for environmental monitoring, aquatic ecology, and understanding complex microbial food webs.
Minimum 1 × 15 mL conical tube
Single-band amplicon from markers (16S/18S/ITS) with ≥ 30 ng/µL (Qubit) in ≥ 30µL volume
At least 3 biological replicates per sample are HIGHLY recommended for statistical analysis and robust scientific evidence.
Quality Check Report
Comprehensive per-sample read quality metrics and sequencing statistics.
Raw Sequencing Files
Raw sequencing reads in standard formats for downstream analysis.
Lineages Plot
Full hierarchical lineage assignments from domain to species level per sample.
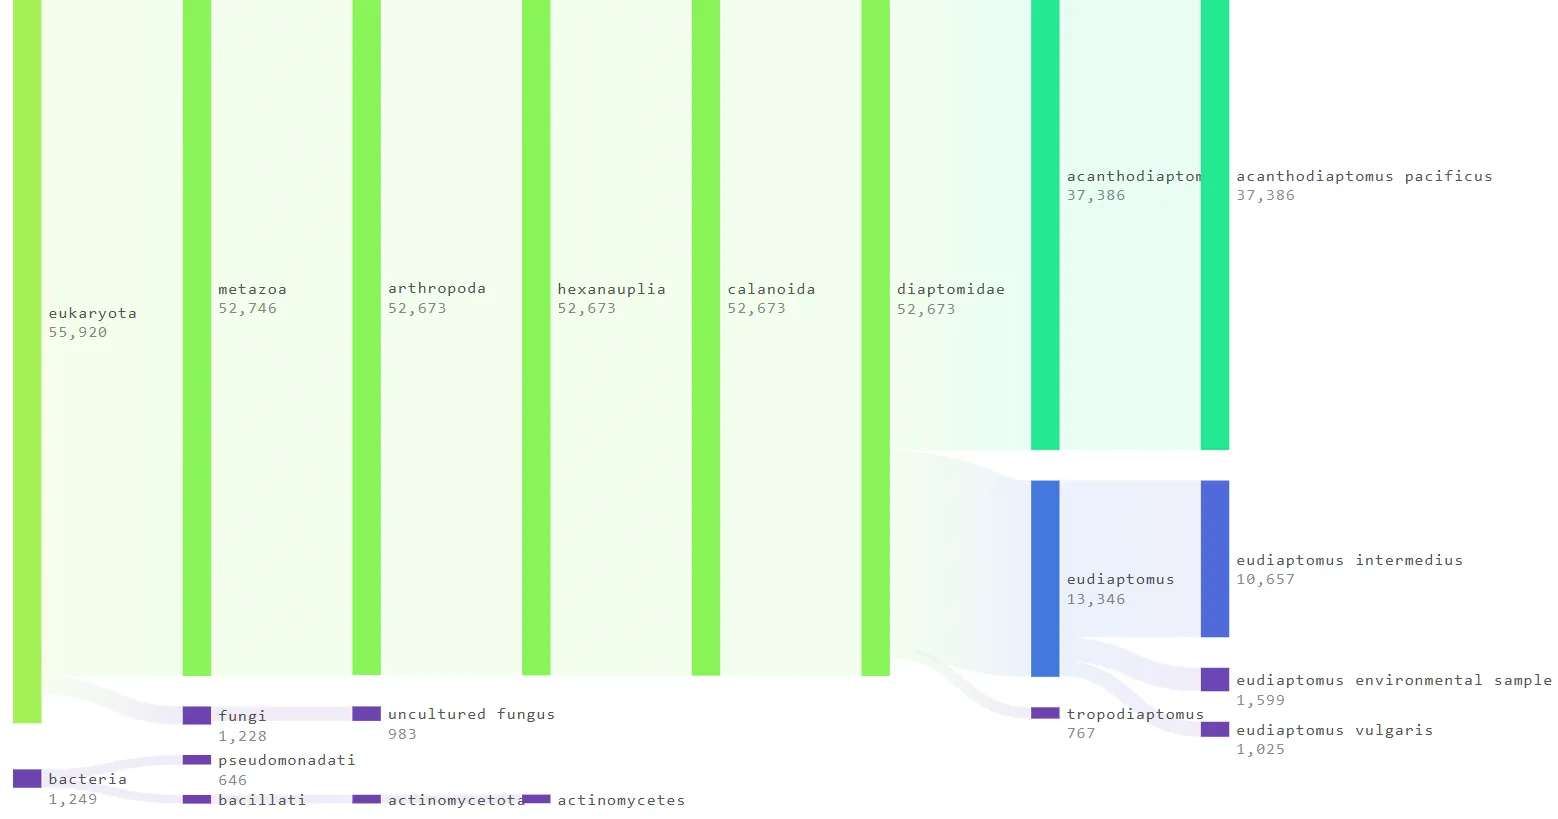
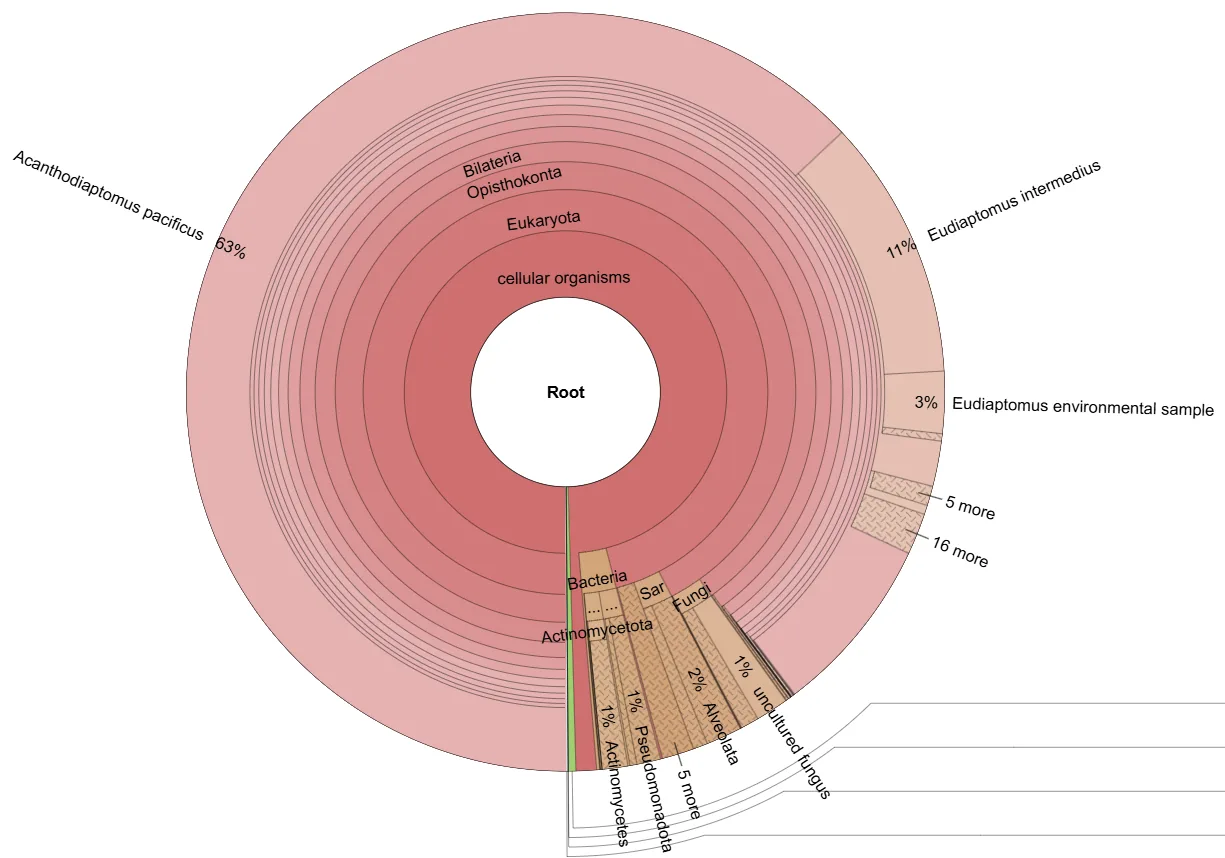
Sunburst Chart
Radial hierarchical visualization of community composition across taxonomic ranks.
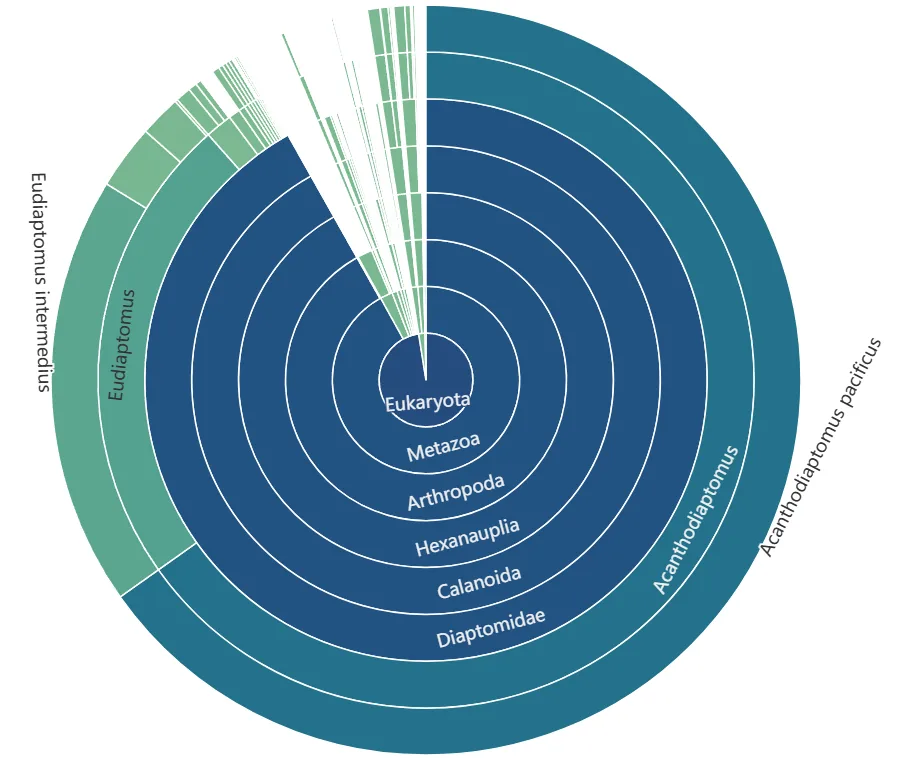
Krona Chart
Interactive Krona HTML chart for exploring per-sample taxonomic composition.
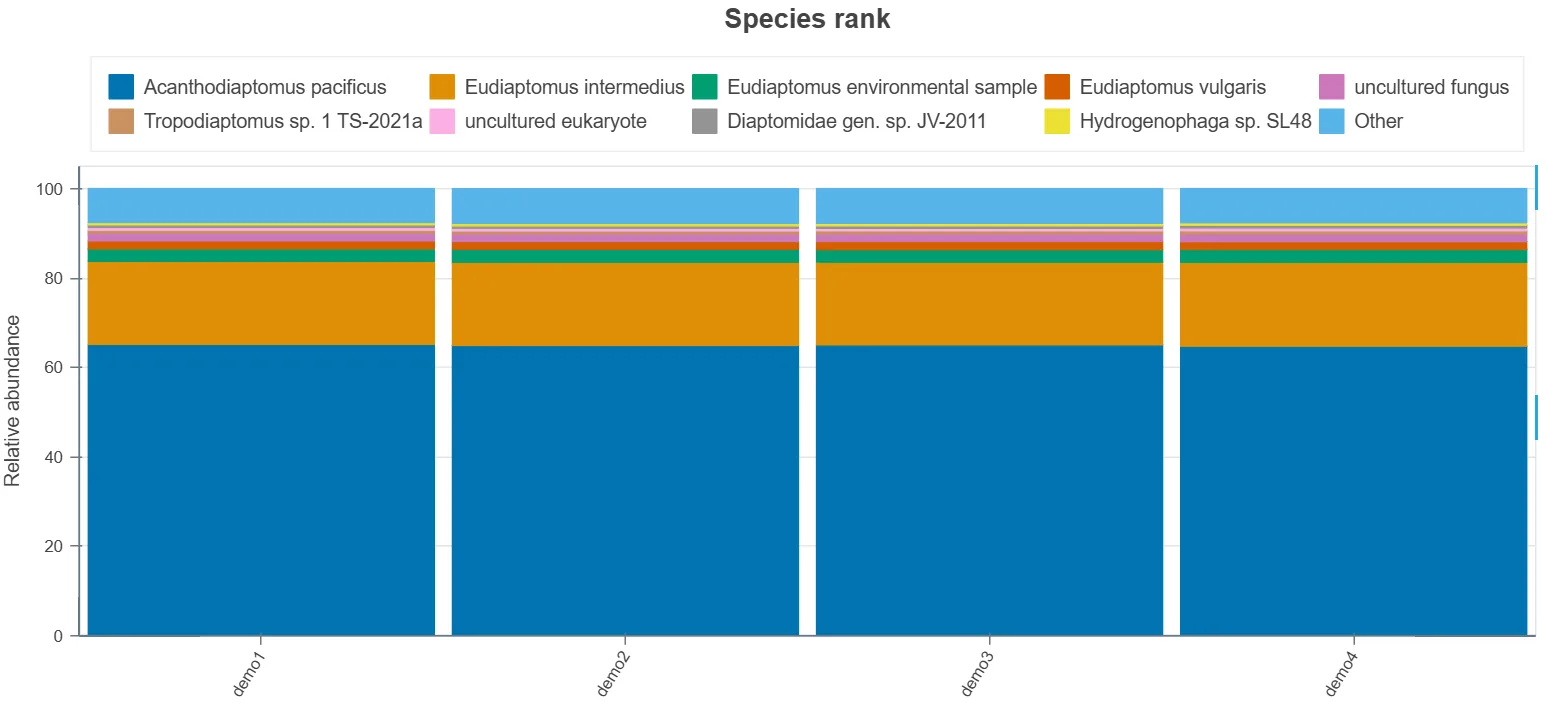
Taxonomic Barplot
Stacked bar chart of relative taxonomic abundance across all samples at multiple ranks.
Alpha Diversity Indices
Statistical diversity metrics summarizing community richness and evenness.
Rarefaction Curve
Species accumulation curves showing observed diversity as a function of sequencing depth.
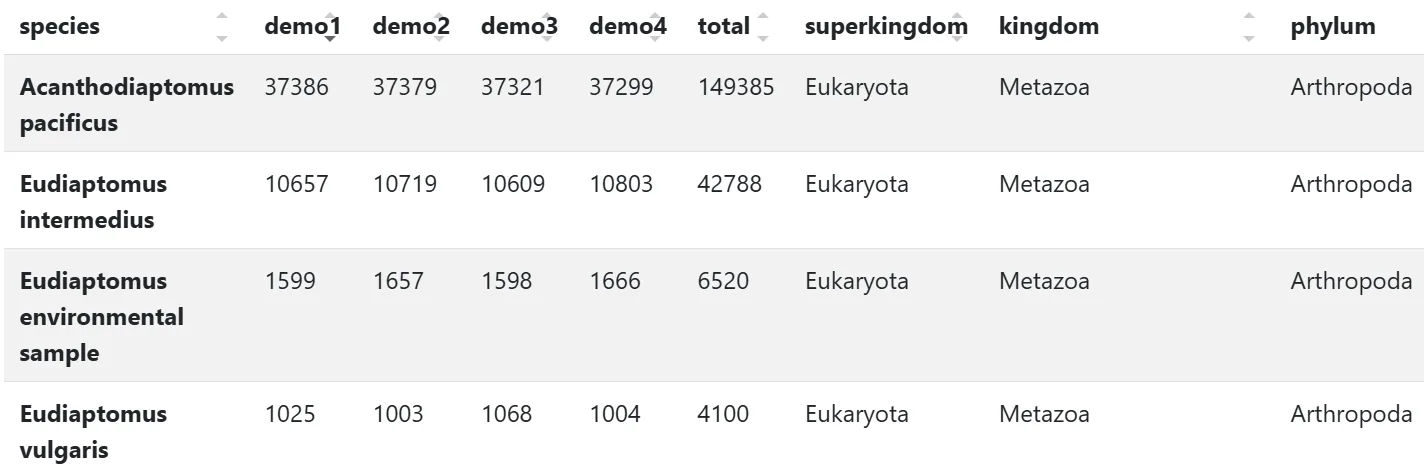
Abundance Table
Quantitative abundance across all sequenced samples.
ITS
Metabarcoding
Targets the Internal Transcribed Spacer region for fungal community characterization. The ITS marker provides species-level resolution for fungal identification, making it invaluable for mycology research, plant pathology, soil health assessment, and food safety applications.
Minimum 1 × 15 mL conical tube
Single-band amplicon from markers (16S/18S/ITS) with ≥ 30 ng/µL (Qubit) in ≥ 30µL volume
At least 3 biological replicates per sample are HIGHLY recommended for statistical analysis and robust scientific evidence.
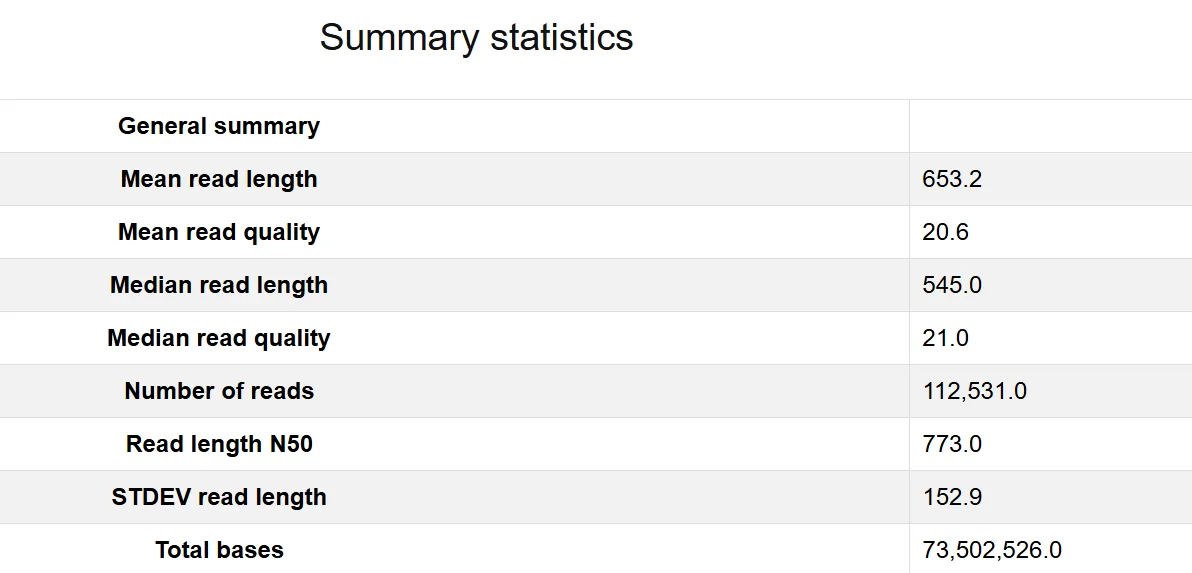
Quality Check Report
Comprehensive per-sample read quality metrics and sequencing statistics.
Raw Sequencing Files
Raw sequencing reads in standard formats for downstream analysis.
Lineages Plot
Full hierarchical lineage assignments from domain to species level per sample.
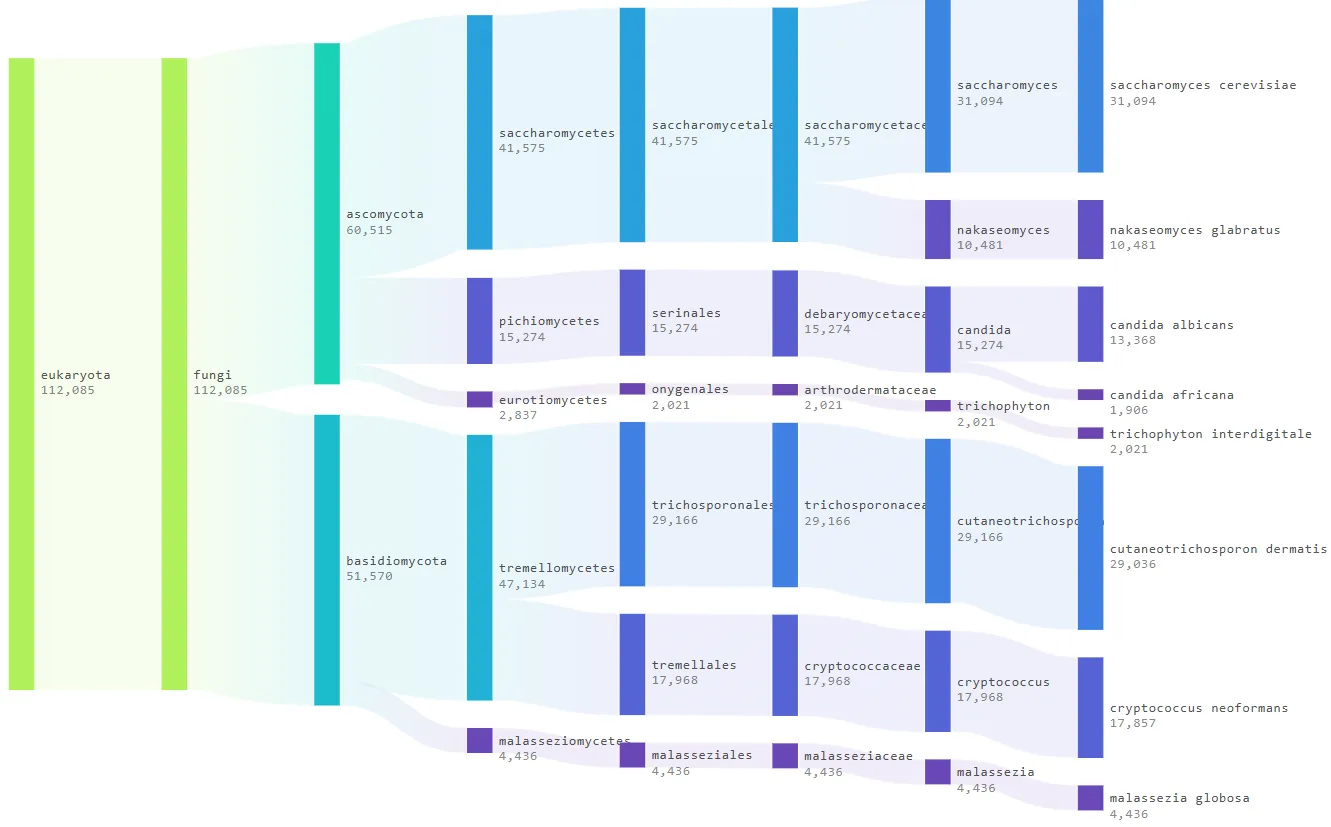
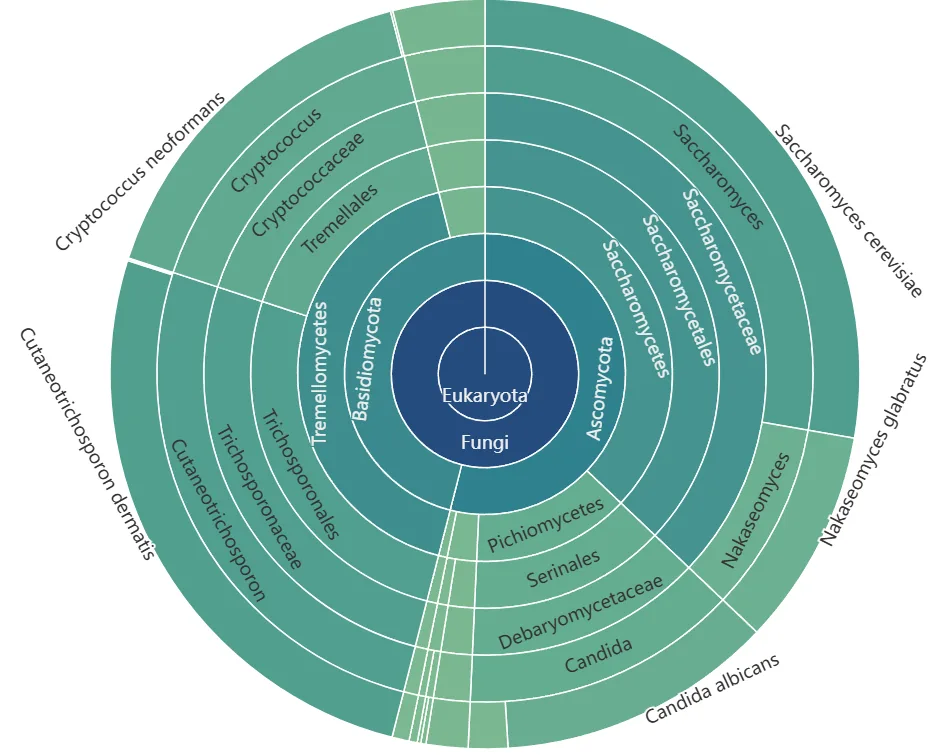
Sunburst Chart
Radial hierarchical visualization of community composition across taxonomic ranks.
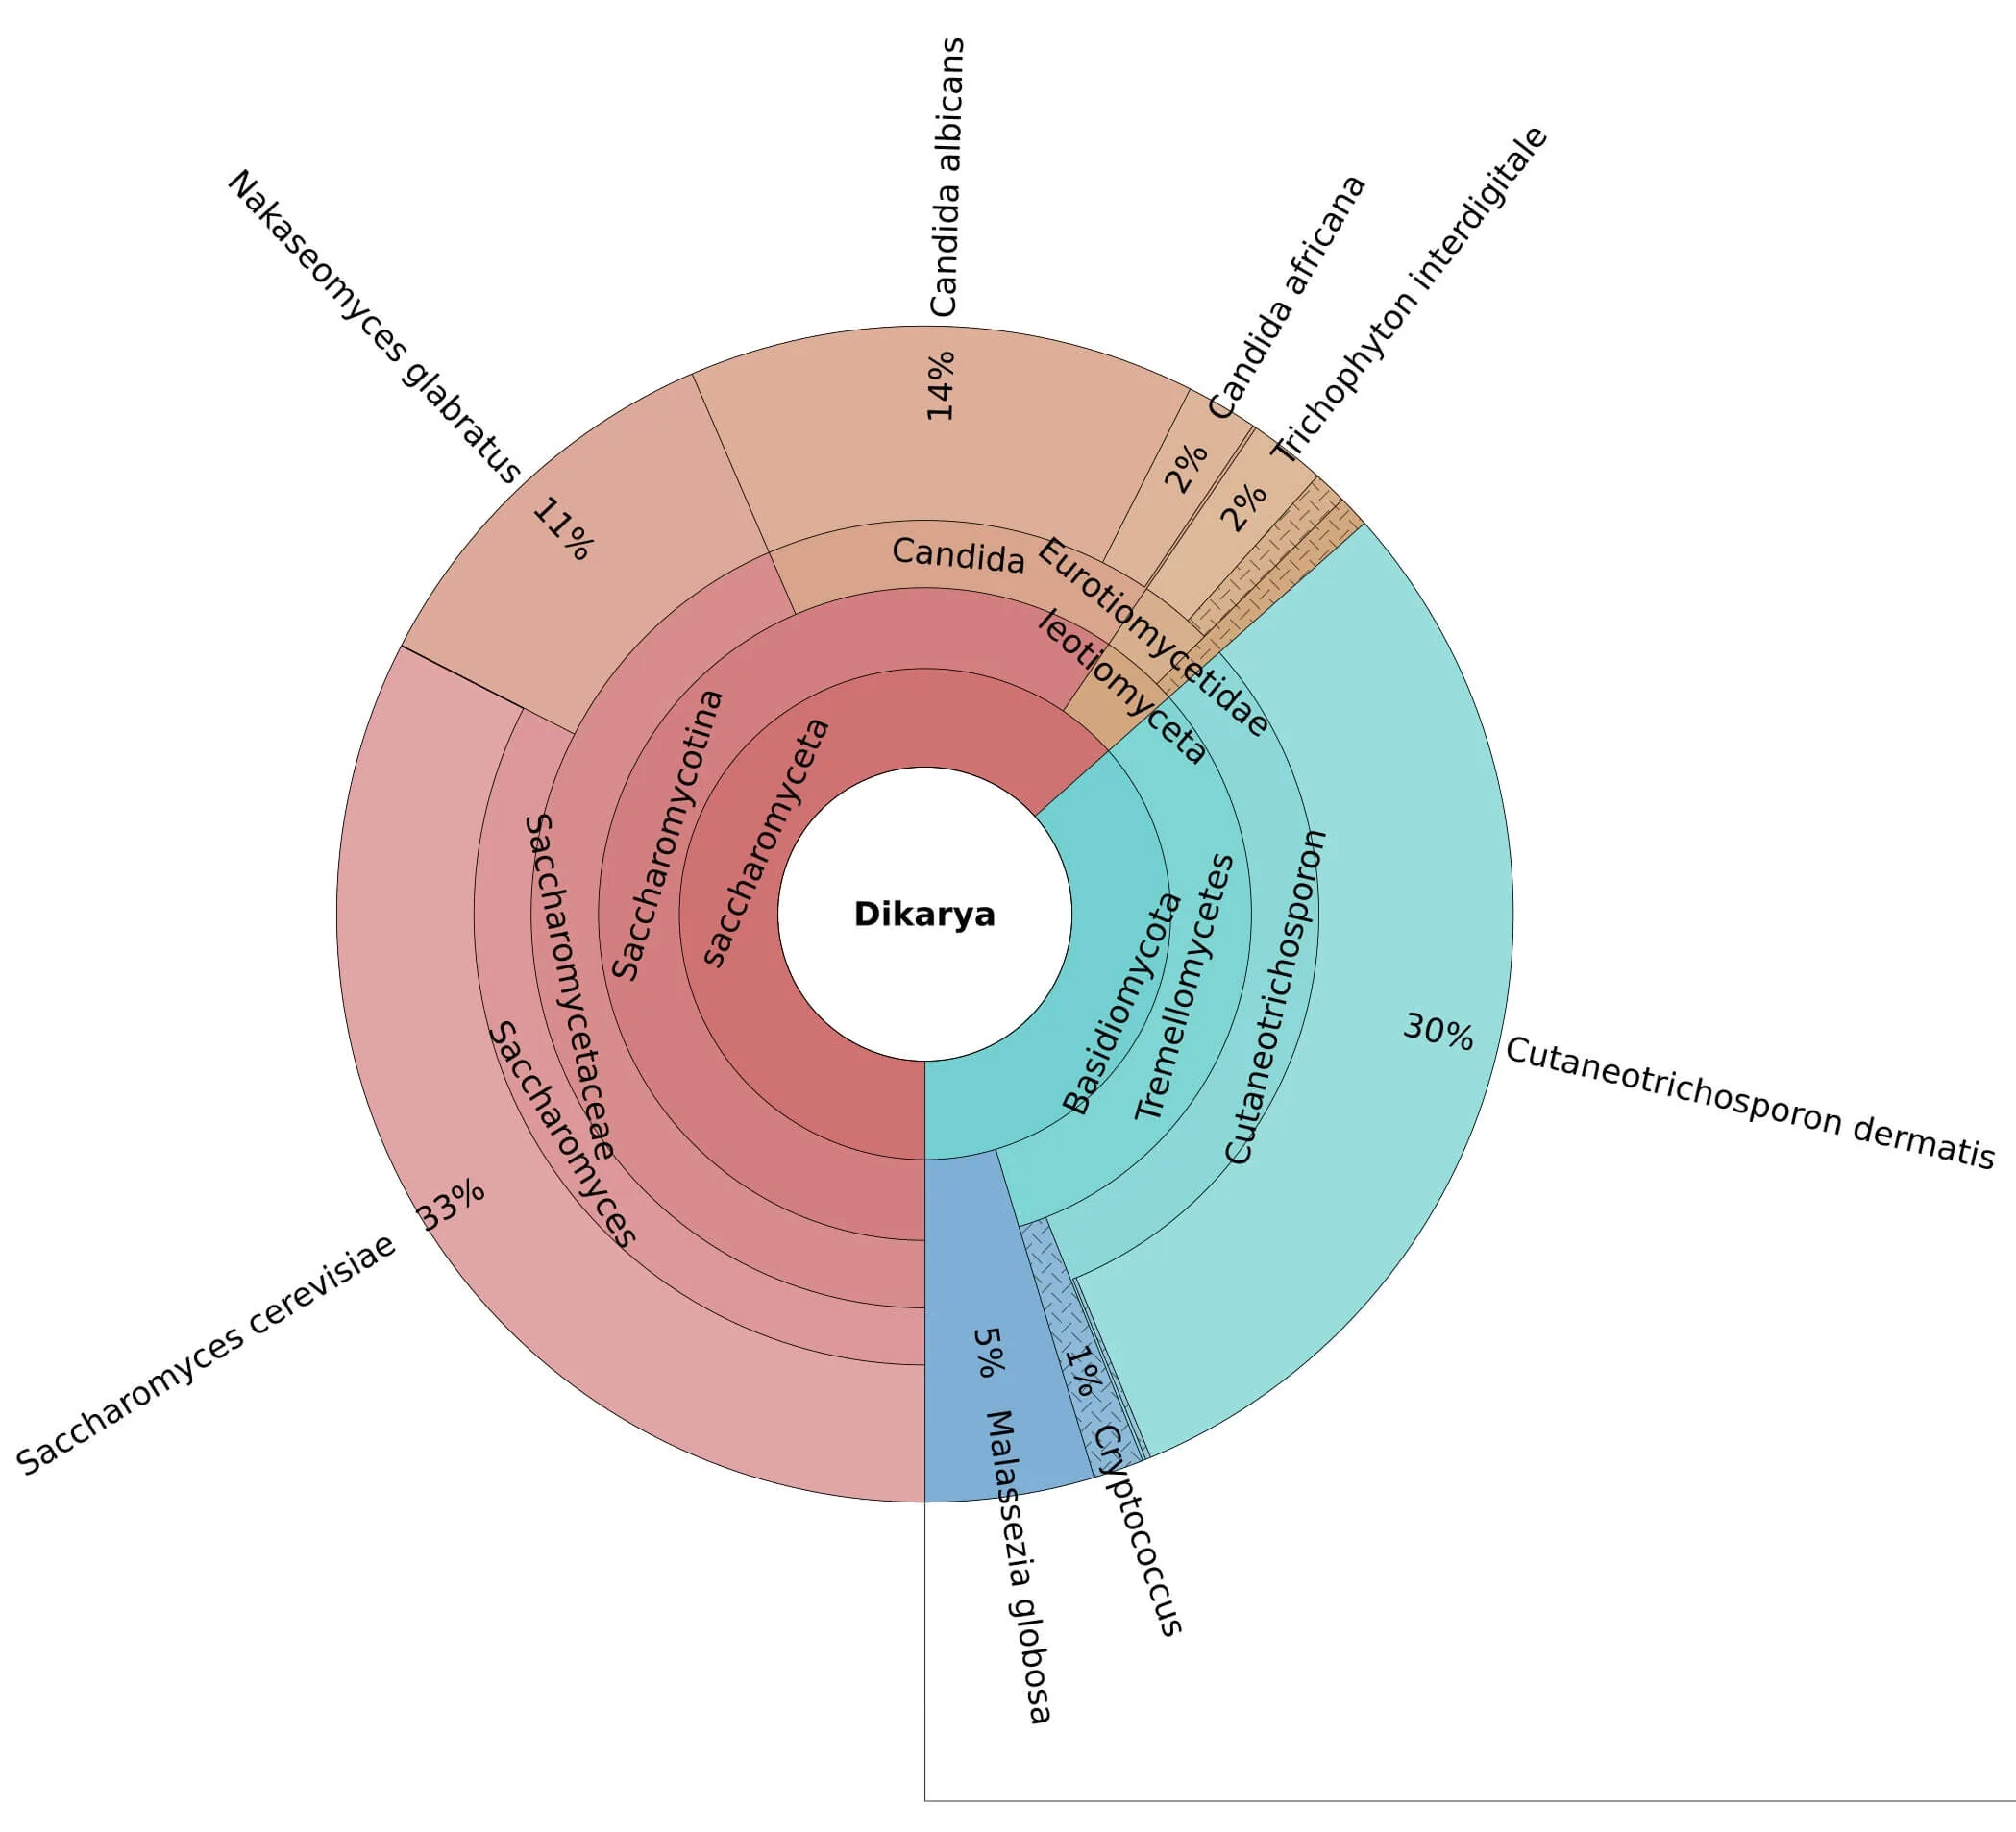
Krona Chart
Interactive Krona HTML chart for exploring per-sample taxonomic composition.
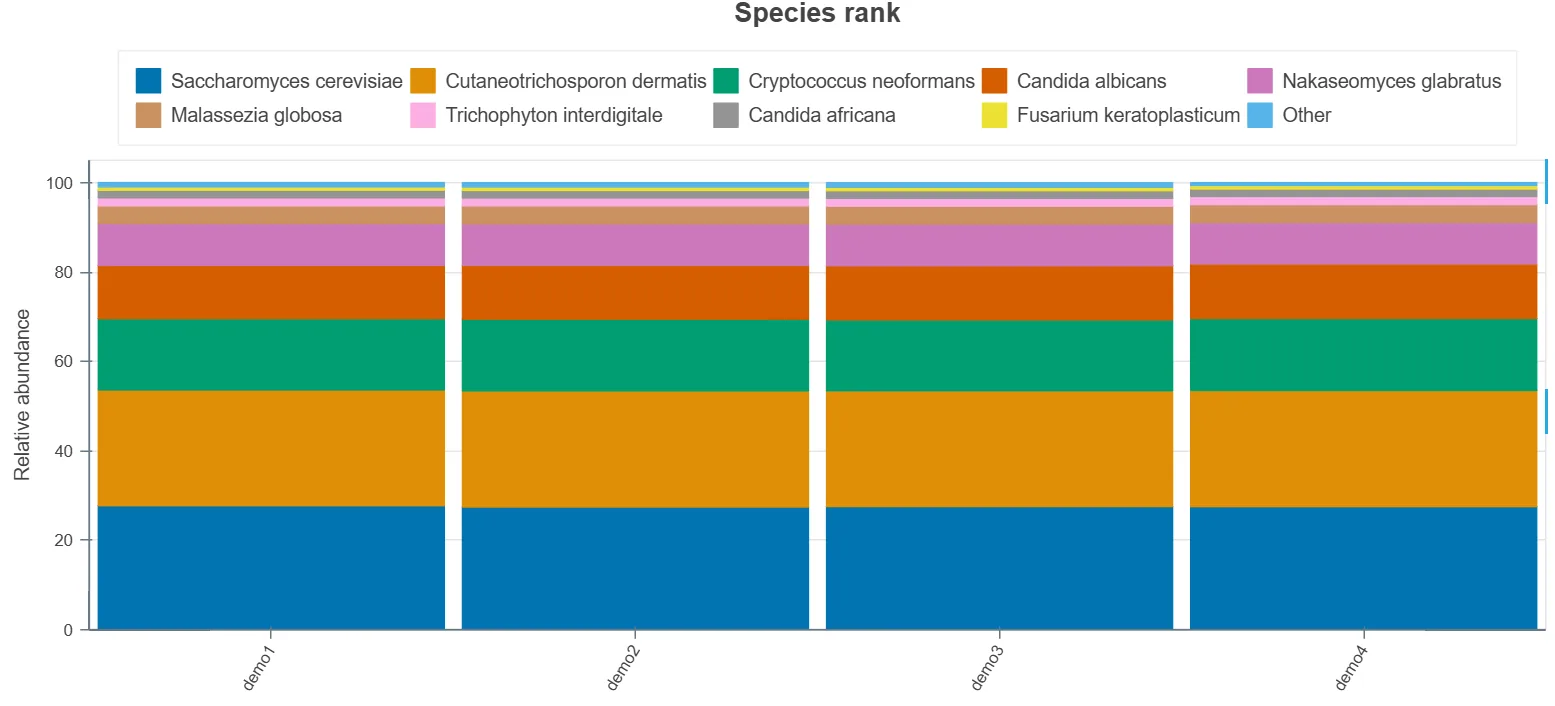
Taxonomic Barplot
Stacked bar chart of relative taxonomic abundance across all samples at multiple ranks.
Alpha Diversity Indices
Statistical diversity metrics summarizing community richness and evenness.
Rarefaction Curve
Species accumulation curves showing observed diversity as a function of sequencing depth.
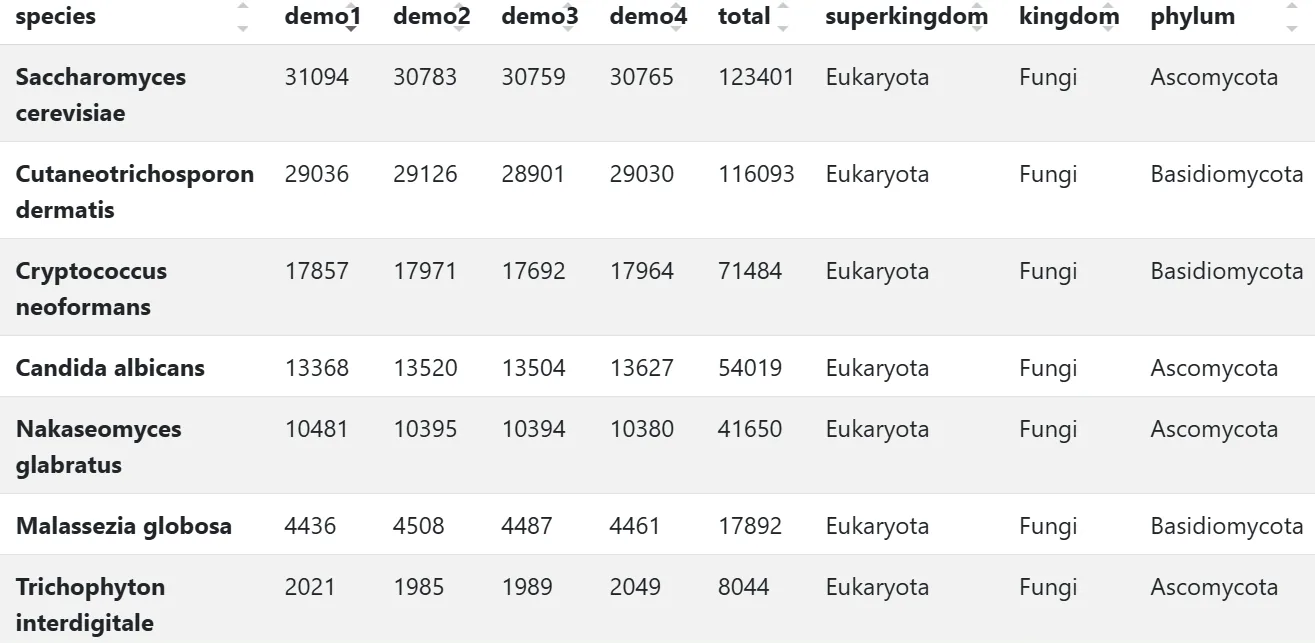
Abundance Table
Quantitative abundance across all sequenced samples.
COI
Metabarcoding
The Cytochrome c Oxidase I gene is the universal DNA barcode for animal species identification. COI metabarcoding enables biodiversity assessment, environmental DNA (eDNA) analysis, diet analysis, and biosecurity screening with high species-level discrimination across the animal kingdom.
Minimum 1 × 15 mL conical tube
Single-band amplicon from markers (16S/18S/ITS) with ≥ 30 ng/µL (Qubit) in ≥ 30µL volume
At least 3 biological replicates per sample are HIGHLY recommended for statistical analysis and robust scientific evidence.
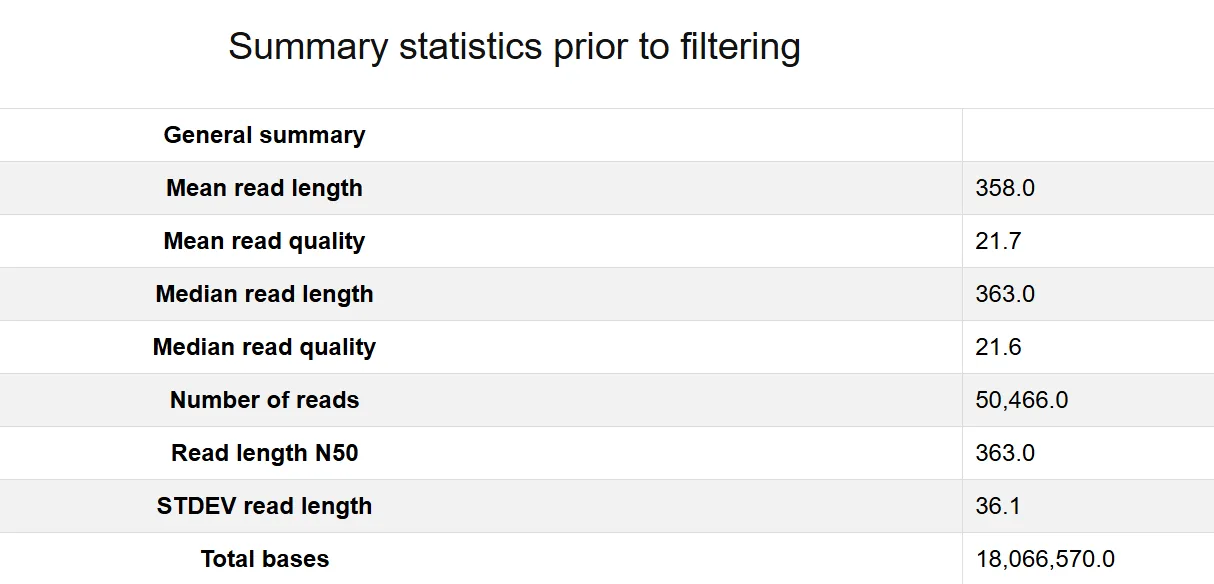
Quality Check Report
Comprehensive per-sample read quality metrics and sequencing statistics.
Raw Sequencing Files
Raw sequencing reads in standard formats for downstream analysis.
Lineages Plot
Full hierarchical lineage assignments from domain to species level per sample.
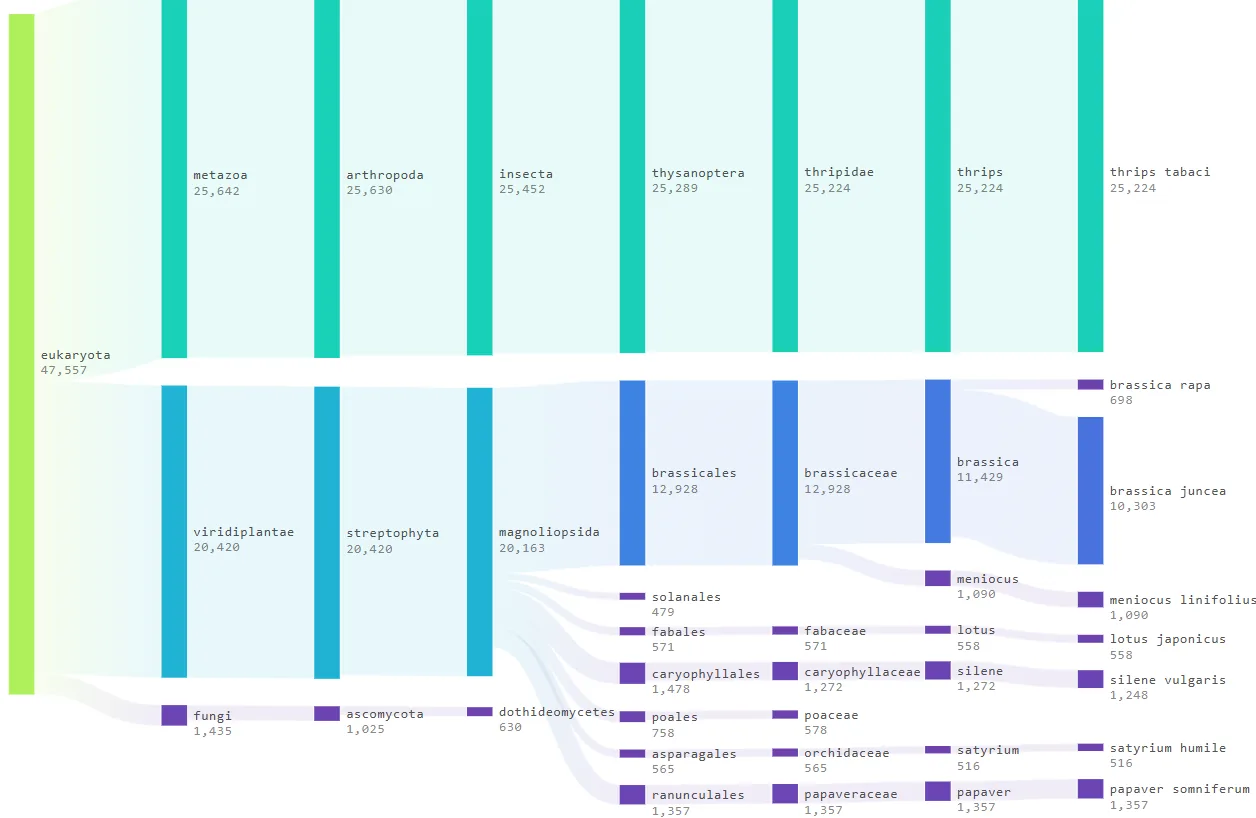
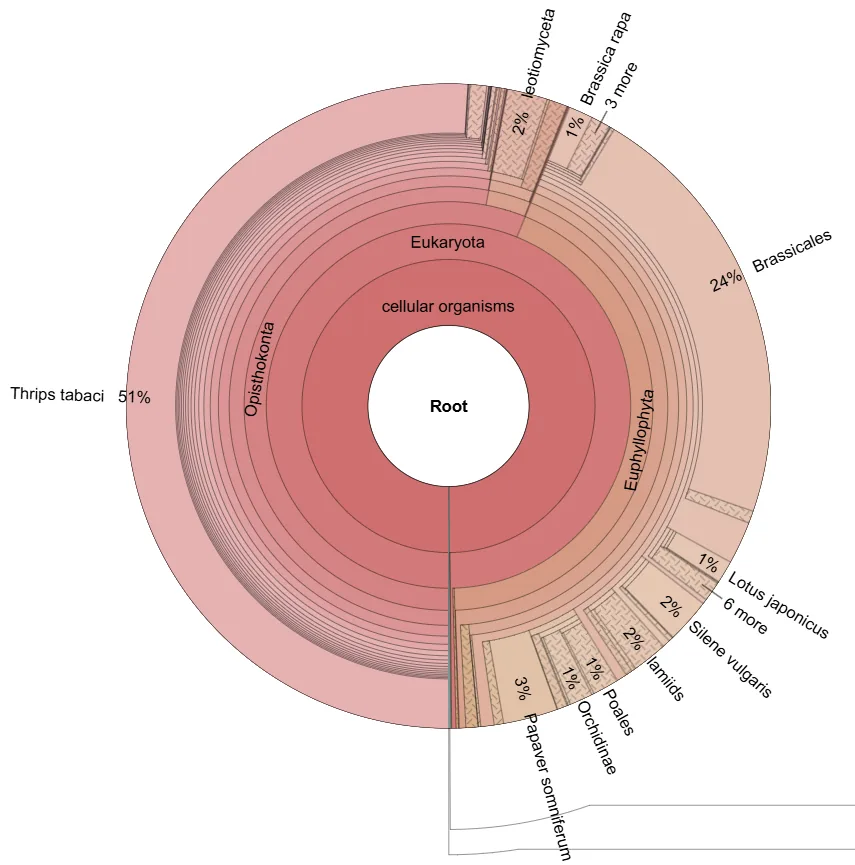
Sunburst Chart
Radial hierarchical visualization of community composition across taxonomic ranks.
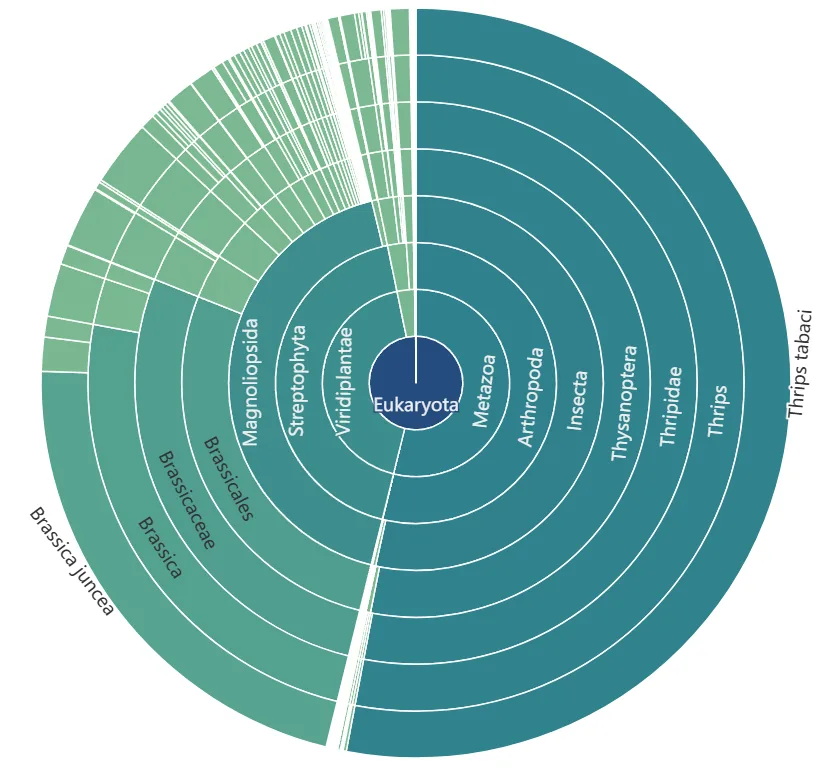
Krona Chart
Interactive Krona HTML chart for exploring per-sample taxonomic composition.
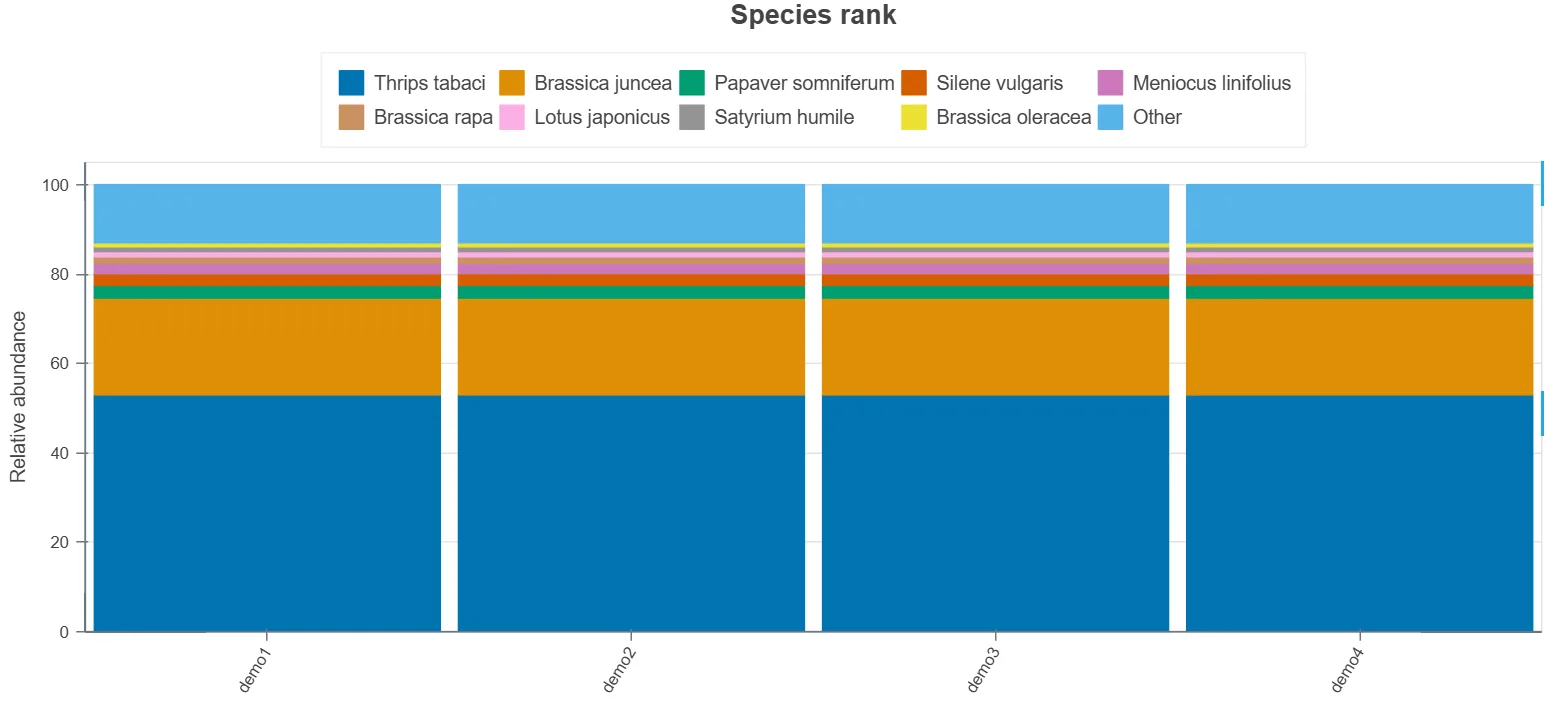
Taxonomic Barplot
Stacked bar chart of relative taxonomic abundance across all samples at multiple ranks.
Alpha Diversity Indices
Statistical diversity metrics summarizing community richness and evenness.
Rarefaction Curve
Species accumulation curves showing observed diversity as a function of sequencing depth.
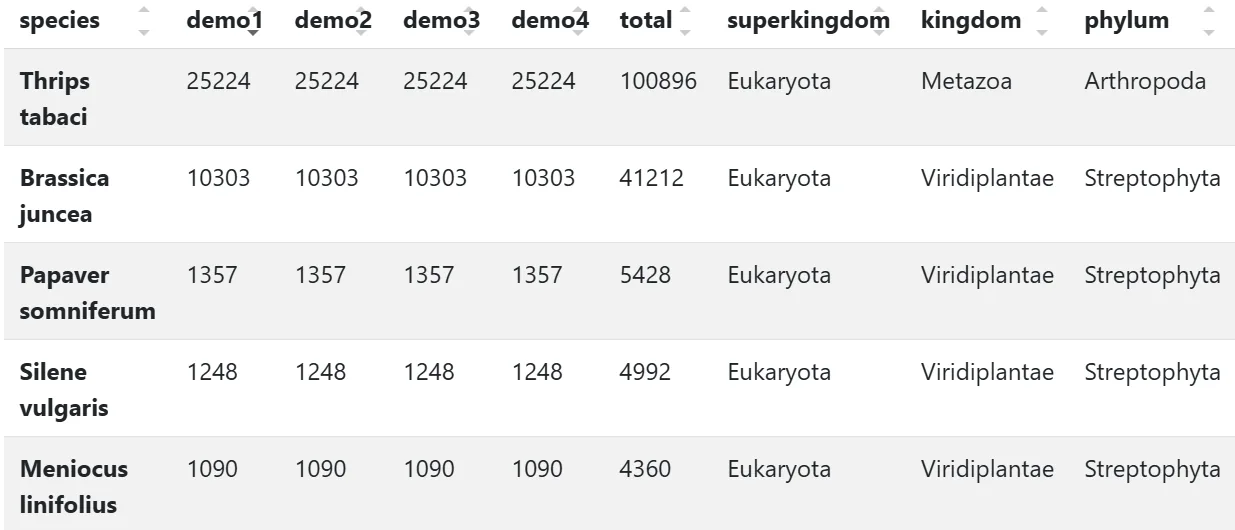
Abundance Table
Quantitative abundance across all sequenced samples.
MiFish
Metabarcoding
Targets the 12S rRNA gene using the MiFish universal primer set for fish environmental DNA (eDNA) detection. Widely adopted for aquatic biodiversity surveys, fisheries stock assessment, and freshwater or marine conservation monitoring with high species-level resolution across teleosts and elasmobranchs.
Minimum 1 × 15 mL conical tube
Single-band amplicon from markers (16S/18S/ITS) with ≥ 30 ng/µL (Qubit) in ≥ 30µL volume
At least 3 biological replicates per sample are HIGHLY recommended for statistical analysis and robust scientific evidence.
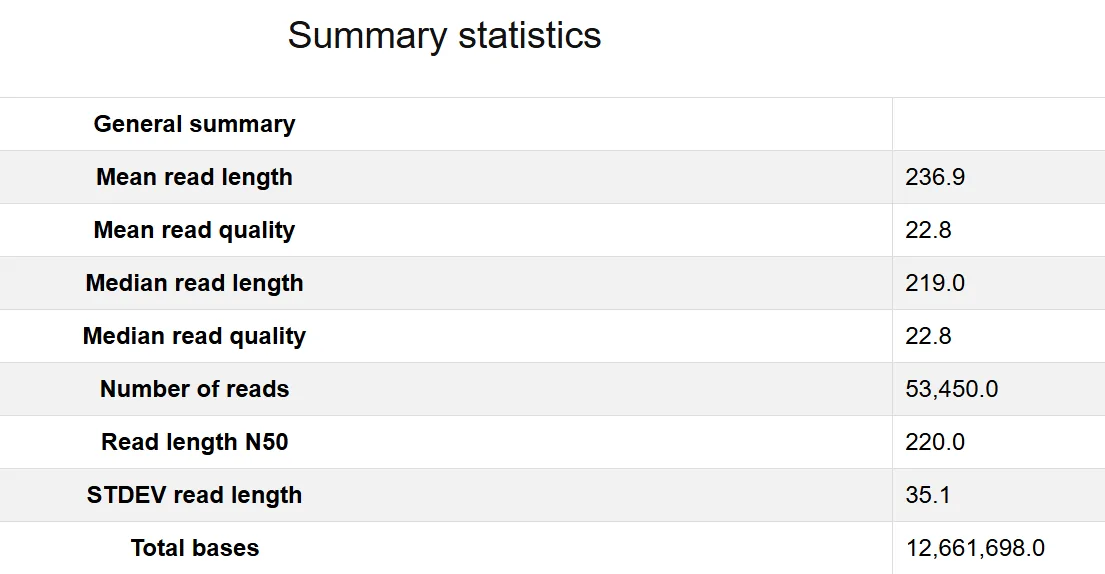
Quality Check Report
Comprehensive per-sample read quality metrics and sequencing statistics.
Raw Sequencing Files
Raw sequencing reads in standard formats for downstream analysis.
MitoFish Abundance Table
Quantitative abundance across all sequenced samples analyzed with MitoFish database.
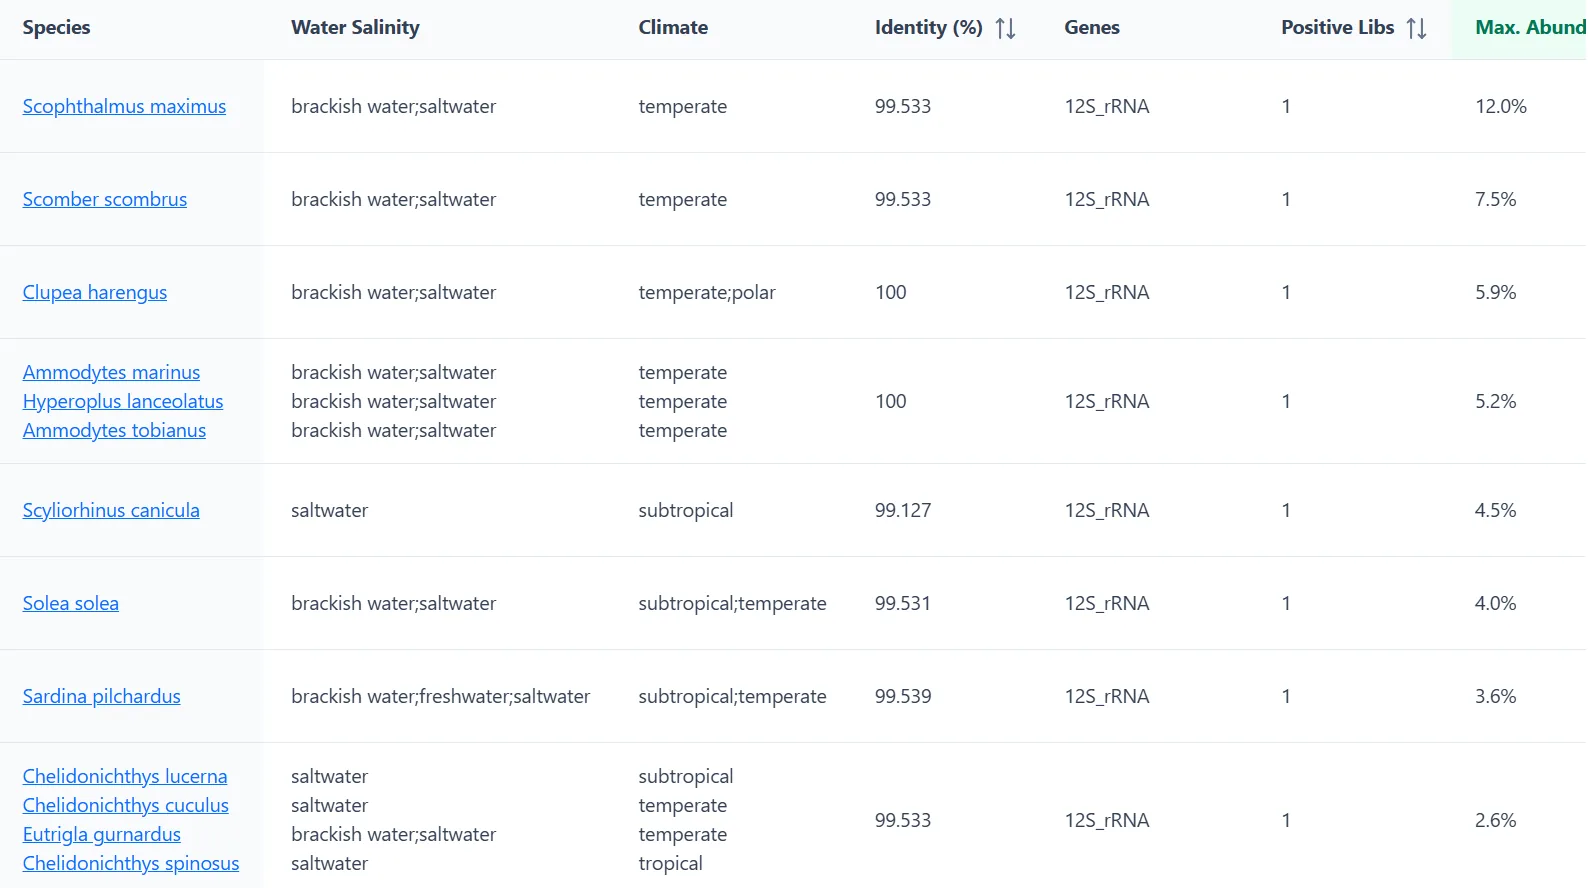
Lineages Plot
Full hierarchical lineage assignments from domain to species level per sample.
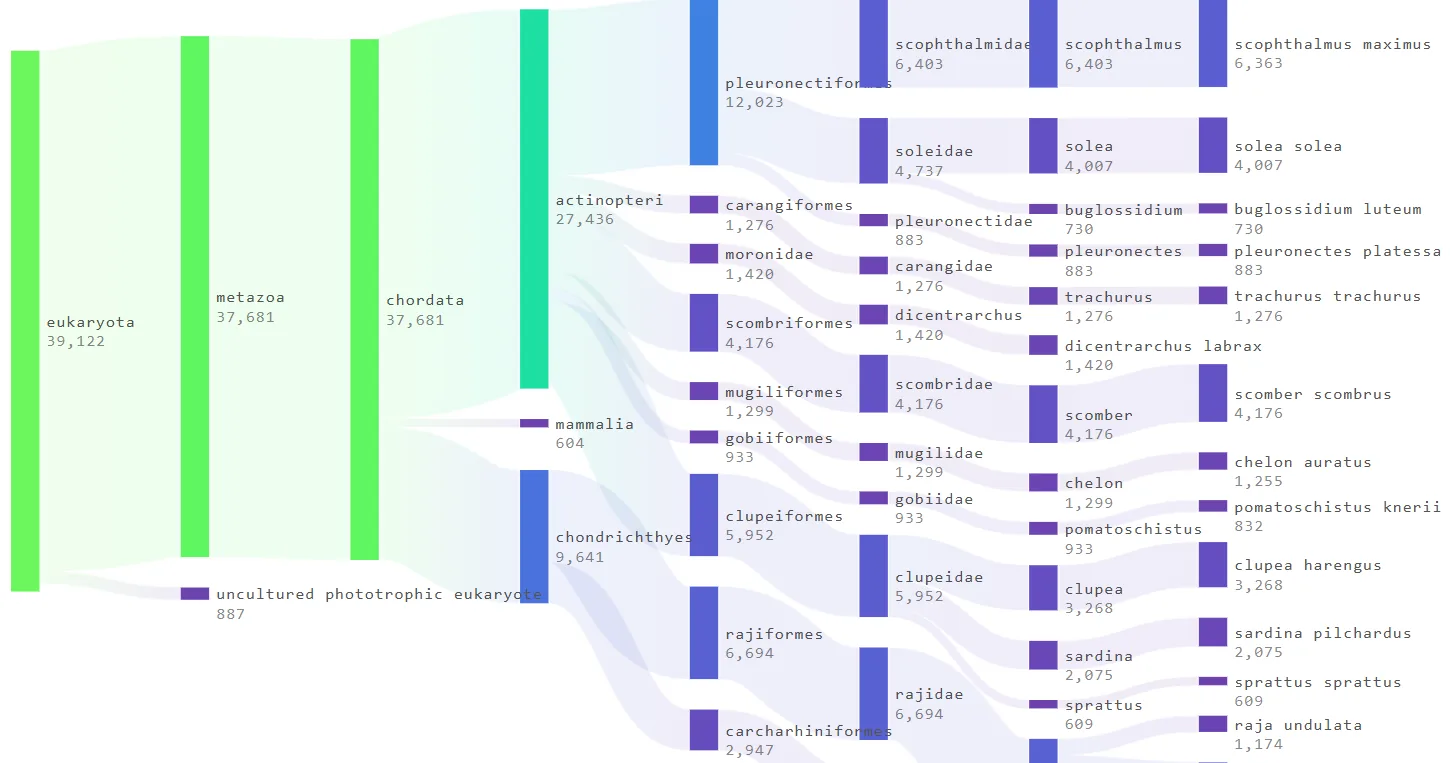
Sunburst Chart
Radial hierarchical visualization of community composition across taxonomic ranks.
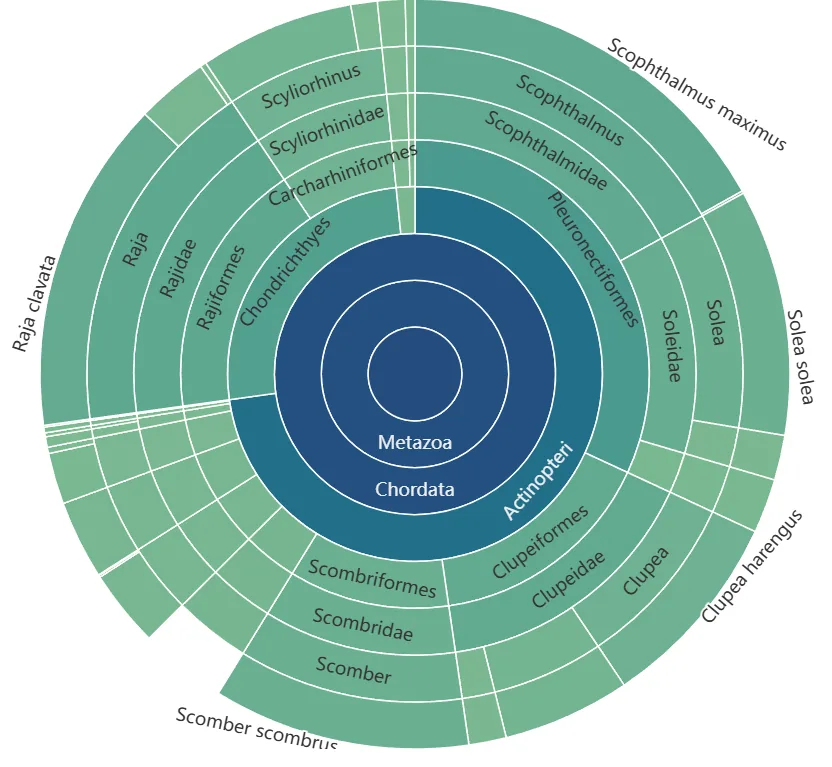
Krona Chart
Interactive Krona HTML chart for exploring per-sample taxonomic composition.
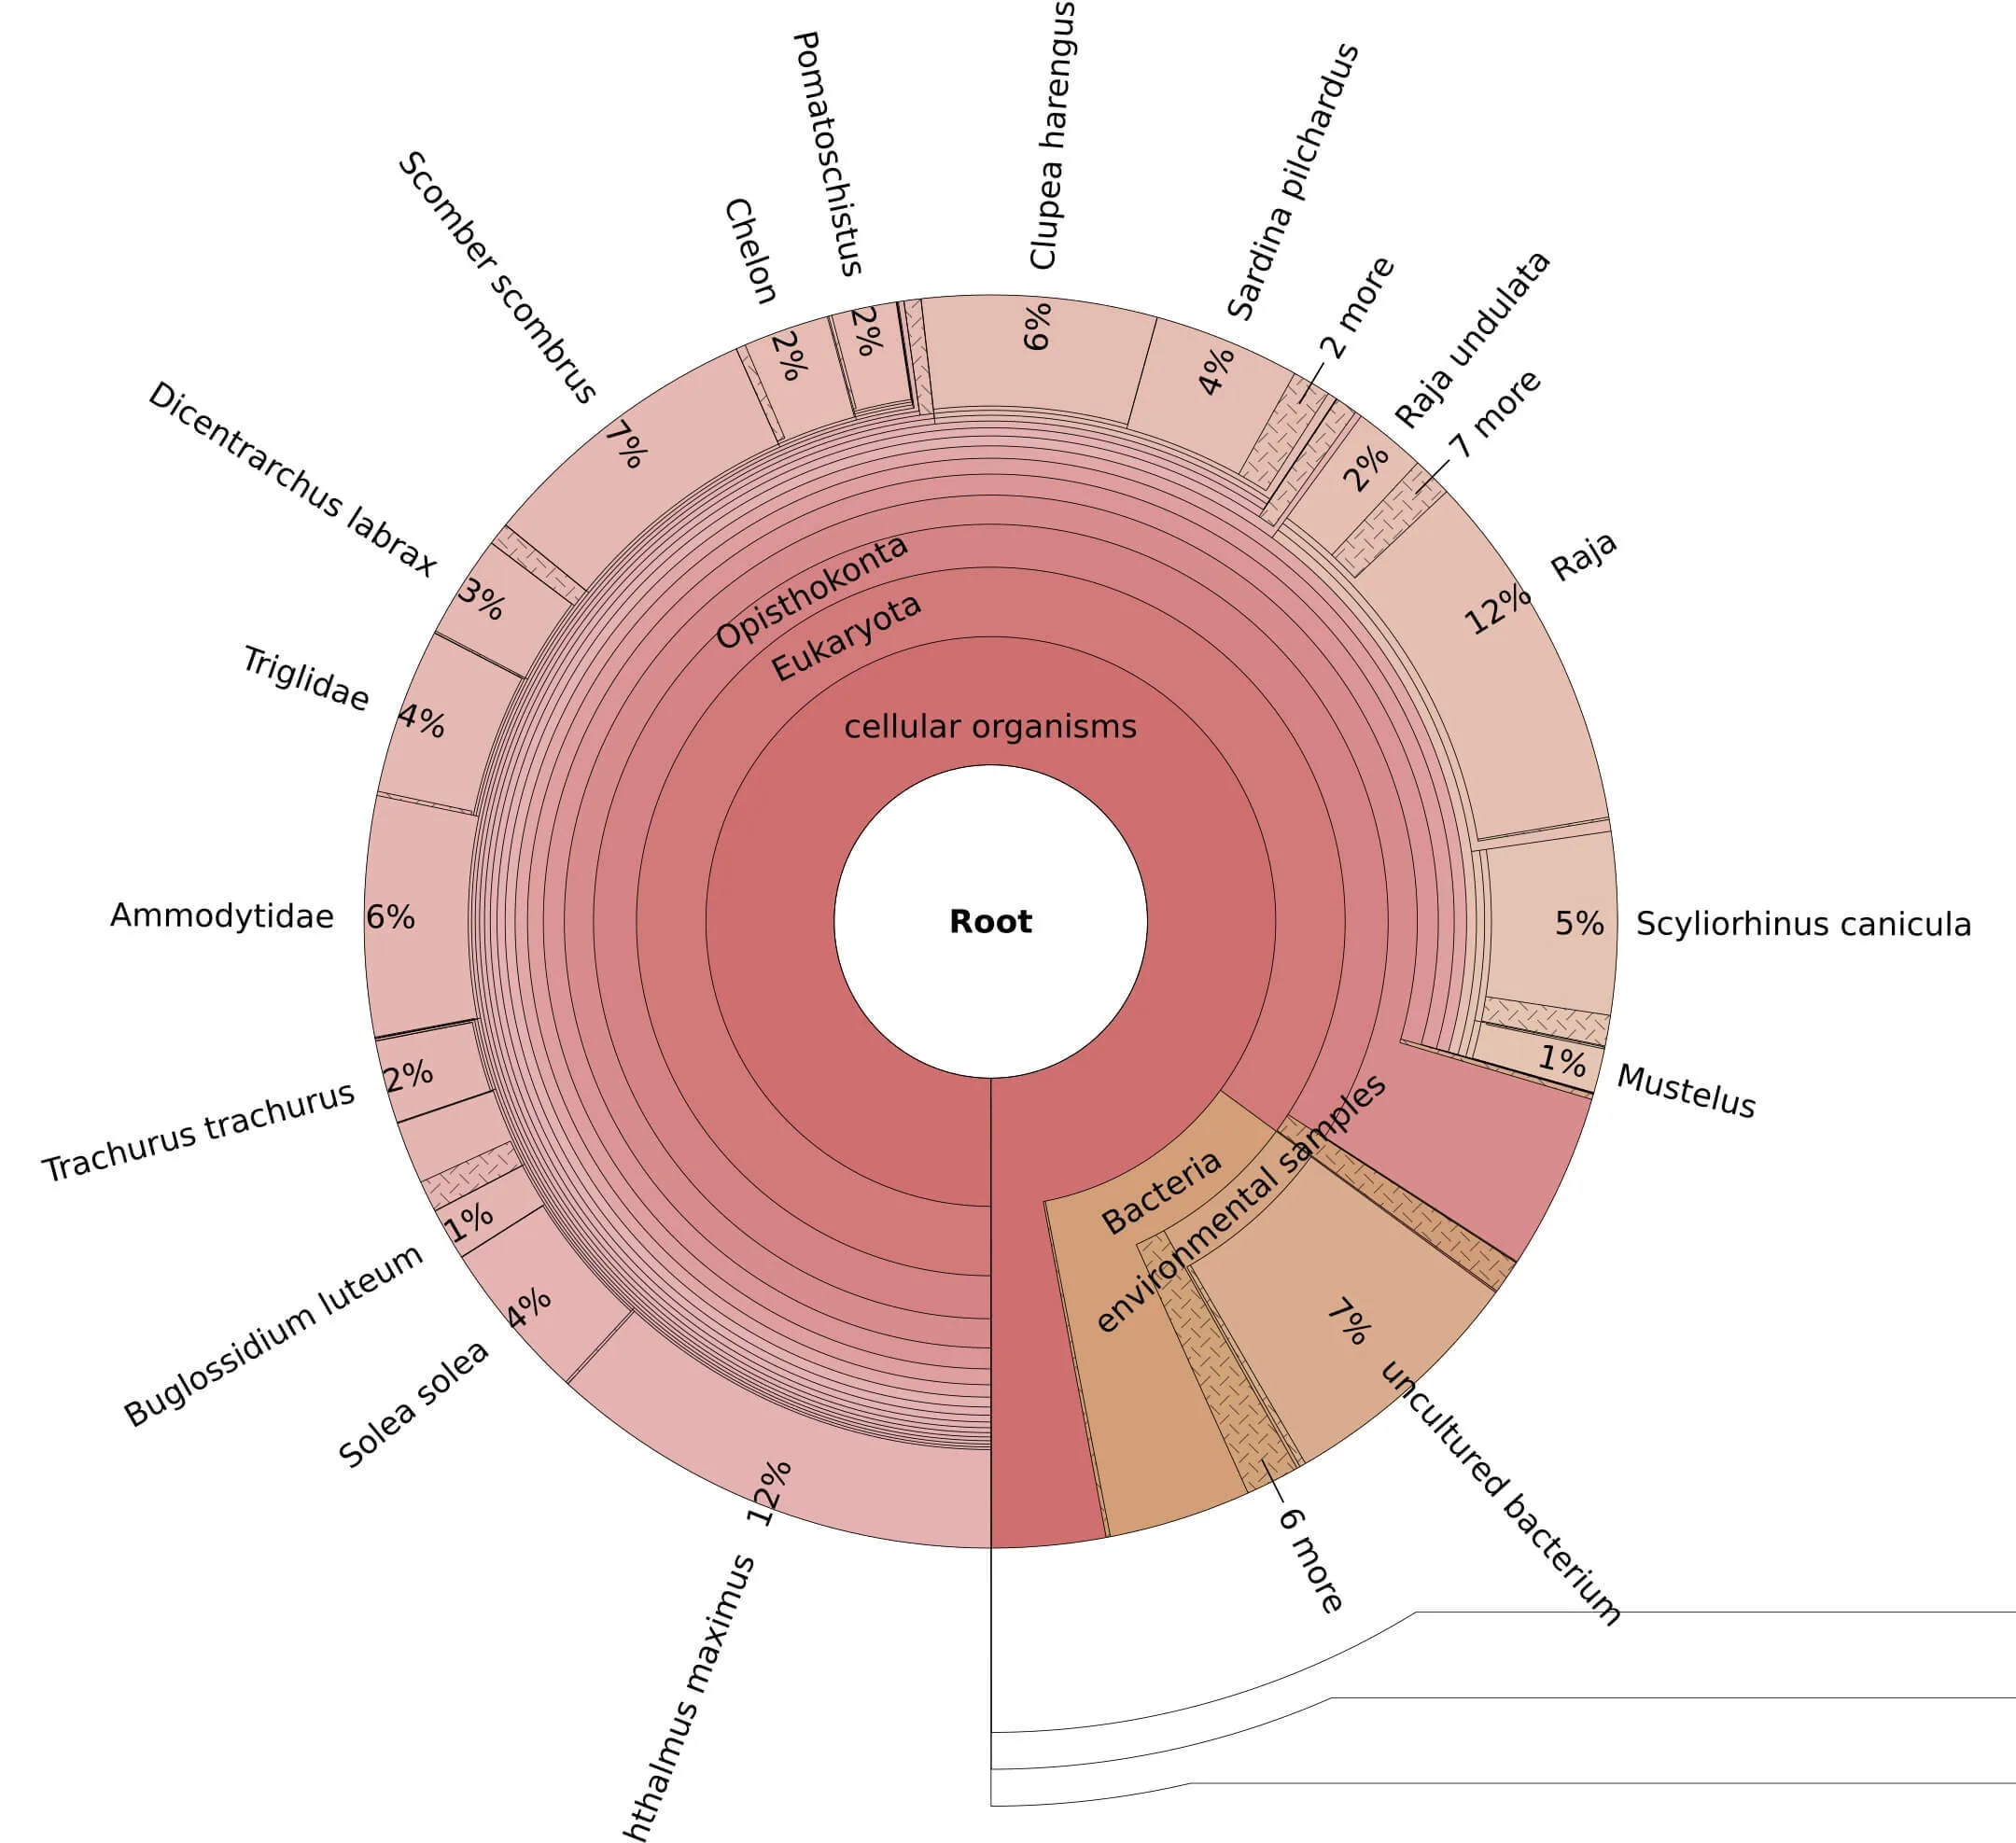
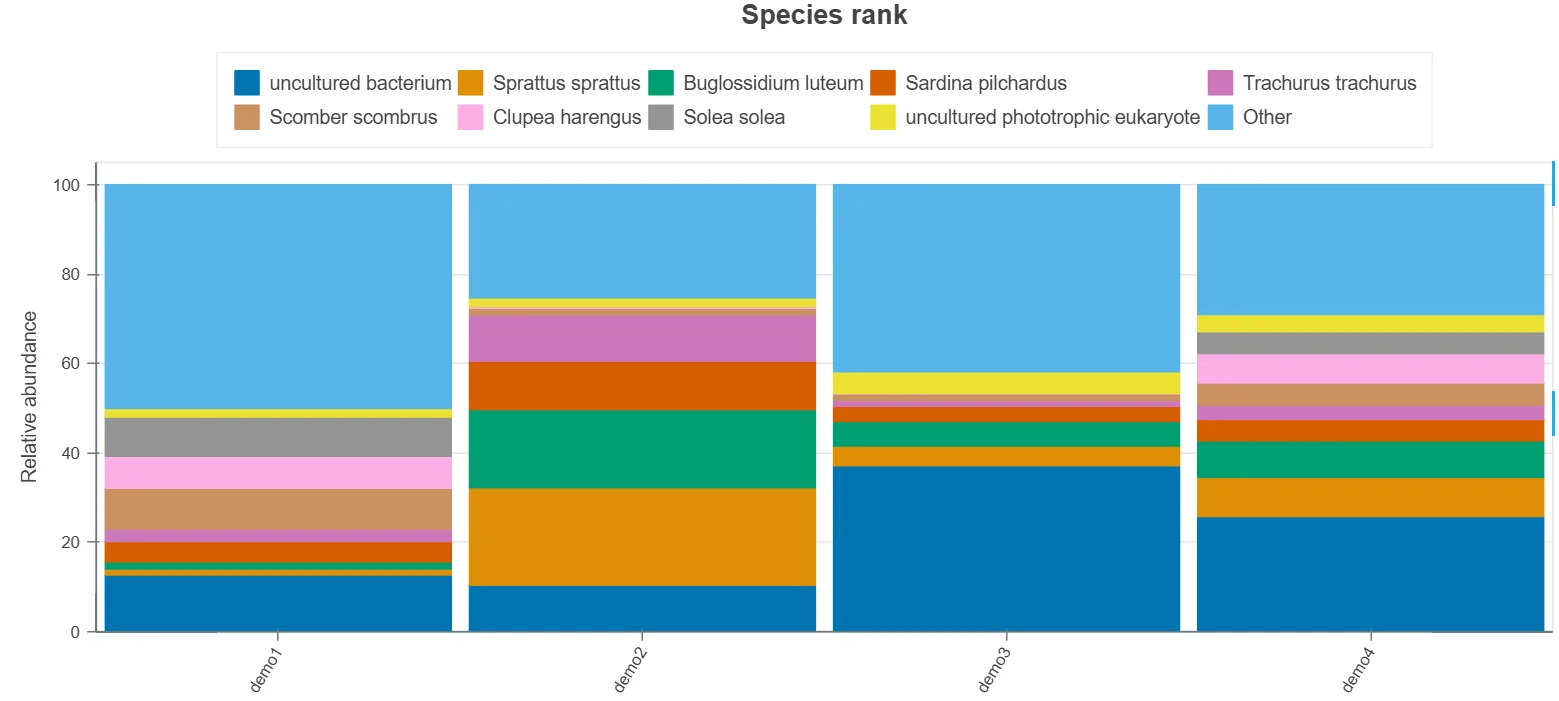
Taxonomic Barplot
Stacked bar chart of relative taxonomic abundance across all samples at multiple ranks.
Alpha Diversity Indices
Statistical diversity metrics summarizing community richness and evenness.
Rarefaction Curve
Species accumulation curves showing observed diversity as a function of sequencing depth.
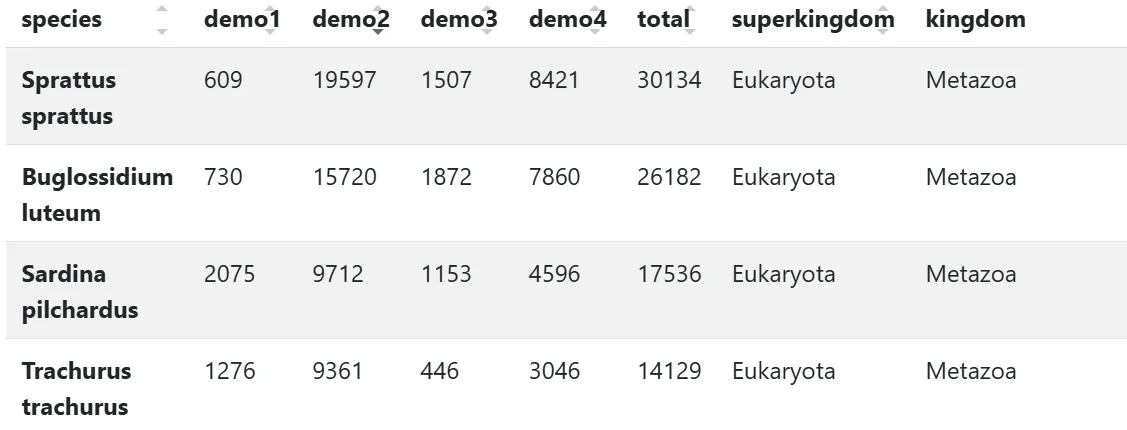
Abundance Table
Quantitative abundance across all sequenced samples analyzed with core_nt database.
Custom
Metabarcoding
Design your own targeted metabarcoding assay with custom marker genes. Whether you need trnL for plant detection, rbcL for algae, or any other specialized marker, we support your specific research objectives.
Minimum 1 × 15 mL conical tube
Single-band amplicon from markers (16S/18S/ITS) with ≥ 30 ng/µL (Qubit) in ≥ 30µL volume
At least 3 biological replicates per sample are HIGHLY recommended for statistical analysis and robust scientific evidence.
Custom primers provided by the clients
Quality Check Report
Per-sample read quality metrics, coverage depth, and basecalling statistics.
Raw Sequencing Files
Raw sequencing reads in standard formats for downstream analysis.
Lineages Plot
Full hierarchical lineage assignments from domain to species level per sample.
Sunburst Chart
Radial hierarchical visualization of community composition across taxonomic ranks.
Krona Chart
Interactive Krona HTML chart for exploring per-sample taxonomic composition.
Taxonomic Barplot
Stacked bar chart of relative taxonomic abundance across all samples at multiple ranks.
Alpha Diversity Indices
Statistical diversity metrics summarizing community richness and evenness.
Rarefaction Curve
Species accumulation curves showing observed diversity as a function of sequencing depth.
Abundance Table
Quantitative abundance across all sequenced samples.
Ready to identify
your species?
Get in touch with our team to discuss your metabarcoding project and receive a customized quote.